
Franklin India Arbitrage Fund
As on April 30, 2026
|
Franklin India Arbitrage Fund As on April 30, 2026 |
|


|
TYPE OF SCHEME
An open-ended scheme investing in arbitrage opportunities
SCHEME CATEGORY
Arbitrage Fund
SCHEME CHARACTERISTICS
Equity related securities including derivative instruments 65%, Debt & Money Market Instruments 35%
INVESTMENT OBJECTIVE
The investment objective of the scheme is to generate capital appreciation and income by predominantly investing in arbitrage opportunities in the cash and derivative segments of the equity markets and the arbitrage opportunities available within the derivative segment and by investing the balance in debt and money market instruments.
DATE OF ALLOTMENT:
November 19, 2024
FUND MANAGER(S):
Mukesh Jain (w.e.f. July 7, 2025),
Rajasa Kakulavarapu, Pallab Roy &
Rohan Maru (w.e.f. December 3, 2024)
BENCHMARK:
Nifty 50 Arbitrage Index
BASE EXPENSE RATIO#: 0.83%
BASE EXPENSE RATIO# (DIRECT) : 0.23%
#Base Expense Ratio (BER) is the actual expense ratio charged as per the AUM slabs and within the BER limits prescribed in Regulation 66 of SEBI MF regulations. BER excludes brokerage and transaction costs incurred towards execution of trades and the applicable statutory levies as on that date. Brokerage and transaction costs incurred towards execution of trades and statutory levies are charged, at actuals, and is over and above the BER.
For Total Expense Ratio (TER) and break up of TER i.e., BER, brokerage and transaction costs and statutory levies, please refer to daily TER disclosures on our website www.franklintempletonindia.com. For detailed understanding of TER, please refer to the TER note on our website. MINIMUM INVESTMENT/
MULTIPLES FOR NEW INVESTORS:
Rs 5000/1 MINIMUM INVESTMENT FOR SIP
Rs 500/1
ADDITIONAL INVESTMENT/
MULTIPLES FOR EXISTING INVESTORS:
Rs1000/1 LOAD STRUCTURE:
Plan A
An open-ended scheme investing in arbitrage opportunities
SCHEME CATEGORY
Arbitrage Fund
SCHEME CHARACTERISTICS
Equity related securities including derivative instruments 65%, Debt & Money Market Instruments 35%
INVESTMENT OBJECTIVE
The investment objective of the scheme is to generate capital appreciation and income by predominantly investing in arbitrage opportunities in the cash and derivative segments of the equity markets and the arbitrage opportunities available within the derivative segment and by investing the balance in debt and money market instruments.
DATE OF ALLOTMENT:
November 19, 2024
FUND MANAGER(S):
Mukesh Jain (w.e.f. July 7, 2025),
Rajasa Kakulavarapu, Pallab Roy &
Rohan Maru (w.e.f. December 3, 2024)
BENCHMARK:
Nifty 50 Arbitrage Index
| TURNOVER | |
| Total Portfolio Turnover$ | 959.18% |
| Portfolio Turnover (Equity)** | 1273.27% |
| $ Includes fixed income securities and equity derivatives ** Computed for equity portion of the portfolio including equity derivatives | |
| MATURITY & YIELD | |
| RESIDUAL MATURITY / AVERAGE MATURITY | 0.71 years |
| ANNUALISED PORTFOLIO YTM# | 7.18% |
| MODIFIED DURATION | 0.62 years |
| MACAULAY DURATION | 0.67 years |
| #Yields of all securities are in annualised terms | |
#Base Expense Ratio (BER) is the actual expense ratio charged as per the AUM slabs and within the BER limits prescribed in Regulation 66 of SEBI MF regulations. BER excludes brokerage and transaction costs incurred towards execution of trades and the applicable statutory levies as on that date. Brokerage and transaction costs incurred towards execution of trades and statutory levies are charged, at actuals, and is over and above the BER.
For Total Expense Ratio (TER) and break up of TER i.e., BER, brokerage and transaction costs and statutory levies, please refer to daily TER disclosures on our website www.franklintempletonindia.com. For detailed understanding of TER, please refer to the TER note on our website. MINIMUM INVESTMENT/
MULTIPLES FOR NEW INVESTORS:
Rs 5000/1 MINIMUM INVESTMENT FOR SIP
Rs 500/1
ADDITIONAL INVESTMENT/
MULTIPLES FOR EXISTING INVESTORS:
Rs1000/1 LOAD STRUCTURE:
| Entry Load | : | Nil |
| Exit Load (for each purchase of Units) | : |
Nil (For 10% of the units purchased on or before
1 Month from the date of allotment) Upto 1 Month - 0.25% Nil - If redeemed after 30 days from the date of allotment (w.e.f. January 06, 2025) |
NAV AS OF APRIL 30, 2026
| Growth Plan | Rs 10.9226 |
| IDCW Plan | Rs 10.9226 |
| Direct - Growth Plan | Rs 11.0366 |
| Direct - IDCW Plan | Rs 11.0366 |
| FUND SIZE (AUM) | |
| Month End | Rs 1186.76 Crores |
| Monthly Average | Rs 1065.67 Crores |
| Outstanding exposure in derivative instruments | Rs 819.85 Crores |
| Outstanding derivative exposure | 69.08% |
| Company Name | No. of shares | Market Value Rs Lakhs | % of Assets | Outstanding derivative exposure as % to net assets Long / (Short ) |
| Aerospace & Defense | ||||
| Bharat Electronics Ltd | 5,77,125 | 2,489.14 | 2.10 | -2.11 |
| Hindustan Aeronautics Ltd | 17,400 | 754.95 | 0.64 | -0.64 |
| Agricultural Food & other Products | ||||
| Patanjali Foods Ltd | 53,100 | 243.97 | 0.21 | -0.21 |
| Marico Ltd | 2,400 | 18.60 | 0.02 | -0.02 |
| Auto Components | ||||
| Samvardhana Motherson International Ltd | 67,650 | 82.00 | 0.07 | -0.07 |
| Exide Industries Ltd | 1,800 | 6.49 | 0.01 | -0.01 |
| Automobiles | ||||
| Mahindra & Mahindra Ltd | 67,000 | 2,075.33 | 1.75 | -1.76 |
| Maruti Suzuki India Ltd | 950 | 126.48 | 0.11 | -0.11 |
| Hero MotoCorp Ltd | 600 | 30.59 | 0.03 | -0.03 |
| Eicher Motors Ltd | 300 | 21.33 | 0.02 | -0.02 |
| Banks | ||||
| HDFC Bank Ltd* | 7,14,200 | 5,511.48 | 4.64 | -4.66 |
| ICICI Bank Ltd* | 4,01,100 | 5,067.50 | 4.27 | -4.31 |
| State Bank of India | 2,37,750 | 2,540.24 | 2.14 | -2.13 |
| Axis Bank Ltd | 1,95,625 | 2,481.11 | 2.09 | -2.11 |
| Punjab National Bank | 14,64,000 | 1,601.03 | 1.35 | -1.35 |
| Kotak Mahindra Bank Ltd | 4,08,000 | 1,563.86 | 1.32 | -1.33 |
| IDFC First Bank Ltd | 14,93,275 | 1,039.92 | 0.88 | -0.88 |
| RBL Bank Ltd | 2,98,450 | 1,004.43 | 0.85 | -0.85 |
| Yes Bank Ltd | 49,13,800 | 979.32 | 0.83 | -0.83 |
| AU Small Finance Bank Ltd | 50,000 | 507.98 | 0.43 | -0.43 |
| Bandhan Bank Ltd | 1,80,000 | 359.50 | 0.30 | -0.30 |
| Canara Bank | 2,49,750 | 336.29 | 0.28 | -0.29 |
| Bank of India | 46,800 | 65.46 | 0.06 | -0.06 |
| IndusInd Bank Ltd | 3,500 | 32.06 | 0.03 | -0.03 |
| Beverages | ||||
| Varun Beverages Ltd | 78,750 | 404.54 | 0.34 | -0.34 |
| United Spirits Ltd | 12,000 | 159.07 | 0.13 | -0.13 |
| Capital Markets | ||||
| Multi Commodity Exchange Of India Ltd | 4,375 | 130.00 | 0.11 | -0.11 |
| Cement & Cement Products | ||||
| Ultratech Cement Ltd | 3,700 | 428.68 | 0.36 | -0.37 |
| Grasim Industries Ltd | 4,250 | 118.77 | 0.10 | -0.10 |
| Chemicals & Petrochemicals | ||||
| Pidilite Industries Ltd | 14,000 | 192.60 | 0.16 | -0.16 |
| Solar Industries India Ltd | 100 | 15.44 | 0.01 | -0.01 |
| Construction | ||||
| Larsen & Toubro Ltd* | 72,800 | 2,922.19 | 2.46 | -2.48 |
| Consumer Durables | ||||
| Asian Paints Ltd | 83,250 | 2,035.05 | 1.71 | -1.72 |
| Crompton Greaves Consumer Electricals Ltd | 46,800 | 127.46 | 0.11 | -0.11 |
| Kalyan Jewellers India Ltd | 10,575 | 43.65 | 0.04 | -0.04 |
| Titan Co Ltd | 875 | 38.37 | 0.03 | -0.03 |
| Diversified FMCG | ||||
| ITC Ltd | 2,83,975 | 894.24 | 0.75 | -0.76 |
| Electrical Equipment | ||||
| Bharat Heavy Electricals Ltd | 73,500 | 259.02 | 0.22 | -0.22 |
| CG Power and Industrial Solutions Ltd | 4,250 | 34.57 | 0.03 | -0.03 |
| Suzlon Energy Ltd | 18,050 | 10.03 | 0.01 | -0.01 |
| Ferrous Metals | ||||
| Steel Authority of India Ltd | 4,55,900 | 841.68 | 0.71 | -0.71 |
| JSW Steel Ltd | 50,625 | 640.15 | 0.54 | -0.54 |
| Tata Steel Ltd | 2,80,500 | 592.86 | 0.50 | -0.50 |
| Fertilizers & Agrochemicals | ||||
| UPL Ltd | 2,71,000 | 1,739.41 | 1.47 | -1.48 |
| Finance | ||||
| Jio Financial Services Ltd | 6,97,950 | 1,719.54 | 1.45 | -1.46 |
| Sammaan Capital Ltd | 9,54,600 | 1,380.45 | 1.16 | -1.17 |
| Bajaj Finance Ltd | 1,35,000 | 1,264.95 | 1.07 | -1.07 |
| Shriram Finance Ltd | 70,950 | 665.05 | 0.56 | -0.56 |
| Bajaj Finserv Ltd | 36,100 | 630.74 | 0.53 | -0.53 |
| PNB Housing Finance Ltd | 38,350 | 401.01 | 0.34 | -0.34 |
| Cholamandalam Investment and Finance Co Ltd | 18,750 | 293.04 | 0.25 | -0.25 |
| Manappuram Finance Ltd | 81,000 | 238.42 | 0.20 | -0.20 |
| Aditya Birla Capital Ltd | 31,000 | 107.11 | 0.09 | -0.09 |
| REC Ltd | 20,300 | 71.92 | 0.06 | -0.06 |
| LIC Housing Finance Ltd | 11,000 | 61.02 | 0.05 | -0.05 |
| Financial Technology (Fintech) | ||||
| One 97 Communications Ltd | 1,32,675 | 1,453.85 | 1.23 | -1.23 |
| Food Products | ||||
| Nestle India Ltd | 38,500 | 561.56 | 0.47 | -0.48 |
| Britannia Industries Ltd | 125 | 7.16 | 0.01 | -0.01 |
| Gas | ||||
| Petronet LNG Ltd | 9,500 | 26.29 | 0.02 | -0.02 |
| Healthcare Services | ||||
| Apollo Hospitals Enterprise Ltd | 5,125 | 391.37 | 0.33 | -0.33 |
| Max Healthcare Institute Ltd | 11,025 | 109.48 | 0.09 | -0.09 |
| Fortis Healthcare Ltd | 3,875 | 35.76 | 0.03 | -0.03 |
| Industrial Manufacturing | ||||
| Mazagon Dock Shipbuilders Ltd | 4,600 | 125.73 | 0.11 | -0.11 |
| Industrial Products | ||||
| APL Apollo Tubes Ltd | 700 | 13.34 | 0.01 | -0.01 |
| Insurance | ||||
| HDFC Life Insurance Co Ltd | 1,96,900 | 1,155.61 | 0.97 | -0.98 |
| ICICI Prudential Life Insurance Co Ltd | 99,900 | 513.34 | 0.43 | -0.43 |
| SBI Life Insurance Co Ltd | 22,875 | 416.10 | 0.35 | -0.35 |
| IT - Software | ||||
| Tata Consultancy Services Ltd | 5,600 | 138.54 | 0.12 | -0.12 |
| Mphasis Ltd | 3,575 | 81.39 | 0.07 | -0.07 |
| Coforge Ltd | 5,625 | 67.27 | 0.06 | -0.06 |
| Leisure Services | ||||
| Jubilant Foodworks Ltd | 77,500 | 370.92 | 0.31 | -0.31 |
| Indian Hotels Co Ltd | 1,000 | 6.36 | 0.01 | -0.01 |
| Metals & Minerals Trading | ||||
| Adani Enterprises Ltd | 84,975 | 2,046.54 | 1.72 | -1.73 |
| Minerals & Mining | ||||
| NMDC Ltd | 4,45,500 | 402.60 | 0.34 | -0.34 |
| Non - Ferrous Metals | ||||
| Hindustan Zinc Ltd | 1,29,850 | 773.84 | 0.65 | -0.65 |
| Hindalco Industries Ltd | 42,000 | 435.96 | 0.37 | -0.37 |
| Oil | ||||
| Oil & Natural Gas Corporation Ltd | 4,36,500 | 1,307.54 | 1.10 | -1.11 |
| Personal Products | ||||
| Godrej Consumer Products Ltd | 9,500 | 101.37 | 0.09 | -0.09 |
| Petroleum Products | ||||
| Reliance Industries Ltd* | 3,55,000 | 5,079.34 | 4.28 | -4.31 |
| Indian Oil Corporation Ltd | 1,02,375 | 145.63 | 0.12 | -0.12 |
| Hindustan Petroleum Corporation Ltd | 2,025 | 7.58 | 0.01 | -0.01 |
| Bharat Petroleum Corporation Ltd | 1,975 | 5.93 | 0.01 | -0.01 |
| Pharmaceuticals & Biotechnology | ||||
| Sun Pharmaceutical Industries Ltd* | 1,48,750 | 2,689.85 | 2.27 | -2.29 |
| Cipla Ltd | 64,500 | 844.69 | 0.71 | -0.71 |
| Laurus Labs Ltd | 34,000 | 374.32 | 0.32 | -0.32 |
| Aurobindo Pharma Ltd | 12,650 | 175.77 | 0.15 | -0.15 |
| Glenmark Pharmaceuticals Ltd | 6,375 | 153.40 | 0.13 | -0.13 |
| Divi's Laboratories Ltd | 2,200 | 143.06 | 0.12 | -0.12 |
| Biocon Ltd | 12,500 | 44.96 | 0.04 | -0.04 |
| Lupin Ltd | 850 | 19.59 | 0.02 | -0.02 |
| Power | ||||
| Tata Power Co Ltd | 4,06,000 | 1,804.87 | 1.52 | -1.53 |
| NTPC Ltd | 1,54,500 | 616.69 | 0.52 | -0.52 |
| Power Grid Corporation of India Ltd | 66,500 | 211.70 | 0.18 | -0.18 |
| NHPC Ltd | 32,000 | 26.62 | 0.02 | -0.02 |
| Adani Green Energy Ltd | 1,800 | 22.09 | 0.02 | -0.02 |
| Adani Power Ltd | 3,550 | 7.88 | 0.01 | -0.01 |
| Realty | ||||
| Godrej Properties Ltd | 70,675 | 1,297.03 | 1.09 | -1.10 |
| DLF Ltd | 28,875 | 169.50 | 0.14 | -0.14 |
| Retailing | ||||
| Eternal Ltd | 10,20,925 | 2,521.99 | 2.13 | -2.14 |
| FSN E-Commerce Ventures Ltd | 1,71,875 | 455.06 | 0.38 | -0.39 |
| Trent Ltd | 3,300 | 136.77 | 0.12 | -0.12 |
| Telecom - Services | ||||
| Vodafone Idea Ltd* | 3,05,19,825 | 3,119.13 | 2.63 | -2.65 |
| Bharti Airtel Ltd | 1,37,275 | 2,590.10 | 2.18 | -2.19 |
| Indus Towers Ltd | 10,200 | 41.81 | 0.04 | -0.04 |
| Transport Infrastructure | ||||
| Adani Ports and Special Economic Zone Ltd | 49,400 | 818.71 | 0.69 | -0.69 |
| GMR Airports Ltd | 20,925 | 20.18 | 0.02 | -0.02 |
| Transport Services | ||||
| Interglobe Aviation Ltd | 300 | 12.89 | 0.01 | -0.01 |
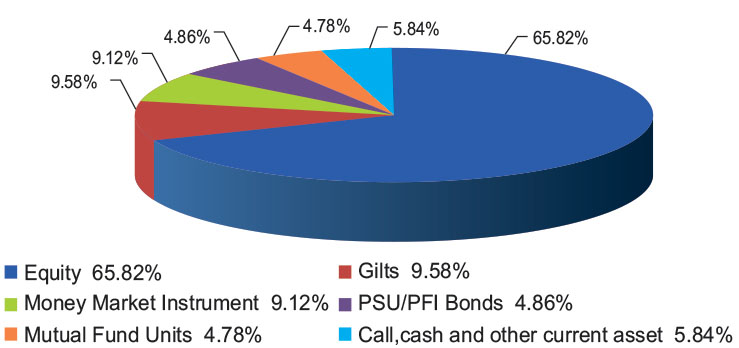
| Total Equity Holdings | 81,499.13 | 68.67 | -69.08 | |
| Company Name | Company Ratings | Market Value (including accrued interest, if any) (Rs. in Lakhs) | % of Assets | |
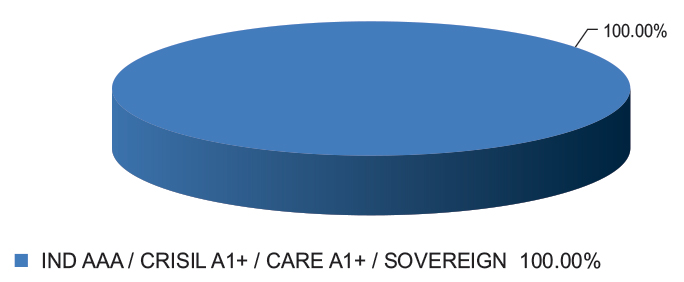
| Jubilant Beverages Ltd | CRISIL AA | 1,184.40 | 1.00 | |
| Poonawalla Fincorp Ltd | CRISIL AAA | 1,001.41 | 0.84 | |
| Jubilant Bevco Ltd | CRISIL AA | 948.31 | 0.80 | |
| Total Corporate Debt | 3,134.11 | 2.64 | ||
| Credila Financial Services Ltd* | CRISIL A1+ | 3,745.45 | 3.16 | |
| Muthoot Finance Ltd | ICRA A1+ | 973.90 | 0.82 | |
| Total Commercial Paper | 4,719.35 | 3.98 | ||
| Union Bank of India* | ICRA A1+ | 5,647.96 | 4.76 | |
| National Bank For Agriculture & Rural Development* | CRISIL A1+ | 4,700.80 | 3.96 | |
| HDFC Bank Ltd | CARE A1+ | 2,359.67 | 1.99 | |
| Total Certificate Of Deposit | 12,708.43 | 10.71 | ||
| Total Debt Holdings | 20,561.89 | 17.33 | ||
| Mutual Fund Units | ||||
| Franklin India Money Market Fund Direct-Growth Plan* | 2,58,09,577 | 14,091.87 | 11.87 | |
| Franklin India Liquid Fund Direct-Growth Plan | 8,934 | 372.36 | 0.31 | |
| Total Mutual Fund Units | 14,464.23 | 12.19 | ||
| Total Holdings | 1,16,525.25 | 98.19 | ||
| Margin on Derivatives | 814.48 | 0.69 | ||
| Call,cash and other current asset | 1,335.98 | 1.13 | ||
| Total Asset | 1,18,675.71 | 100.00 | ||
| * Top 10 holdings | ||||
@ TREPs /Reverse Repo : 5.83%, Others (Cash/ Subscription receivable/ Redemption payable/ Receivables on sale/Payable on Purchase/ Other Receivable / Other Payable) : -4.70%
Note : Pursuant to downgrade of securities issued by Yes Bank Ltd to below investment grade on March 6, 2020 by ICRA, the AMC has created the segregated
portfolio in the scheme. For purpose of disclosure, this change has been incorporated in the scheme name.