Franklin India Balanced Advantage Fund
As on March 31, 2026
|
Franklin India Balanced Advantage Fund As on March 31, 2026 |
|


|
TYPE OF SCHEME
An open-ended dynamic asset allocation fund investing in a dynamically managed portfolio of equity & equity related instruments and fixed income and money market instruments.
SCHEME CATEGORY
Dynamic Asset Allocation or Balanced Advantage Fund
SCHEME CHARACTERISTICS
Investment in equity / debt that is managed dynamically
INVESTMENT OBJECTIVE
The Scheme intends to generate long-term capital appreciation and income generation by investing in a dynamically managed portfolio of equity & equity related instruments and fixed income and money market instruments. There can be no assurance that the investment objective of the scheme will be realized.
DATE OF ALLOTMENT:
September 06, 2022
FUND MANAGER(S):
Rajasa Kakulavarapu (Equity)
Venkatesh Sanjeevi (w.e.f. October 4, 2024)
Chandni Gupta (w.e.f. March 07, 2024)
Anuj Tagra (w.e.f. March 07, 2024)
Rahul Goswami (Debt) (w.e.f. November 10, 2023)
Sandeep Manam
(dedicated for making investments for Foreign Securities)
BENCHMARK:
NIFTY 50 Hybrid Composite Debt 50:50 Index
EXPENSE RATIO#: 1.96%
EXPENSE RATIO# (DIRECT) : 0.53%
# The above ratio includes the GST on Investment Management Fees. The rates specified are the actual expenses charged as at the end of the month. MINIMUM INVESTMENT/
MULTIPLES FOR NEW INVESTORS:
Rs 5000/1 MINIMUM INVESTMENT FOR SIP
Rs 500/1
ADDITIONAL INVESTMENT/
MULTIPLES FOR EXISTING INVESTORS:
Rs1000/1 LOAD STRUCTURE:
An open-ended dynamic asset allocation fund investing in a dynamically managed portfolio of equity & equity related instruments and fixed income and money market instruments.
SCHEME CATEGORY
Dynamic Asset Allocation or Balanced Advantage Fund
SCHEME CHARACTERISTICS
Investment in equity / debt that is managed dynamically
INVESTMENT OBJECTIVE
The Scheme intends to generate long-term capital appreciation and income generation by investing in a dynamically managed portfolio of equity & equity related instruments and fixed income and money market instruments. There can be no assurance that the investment objective of the scheme will be realized.
DATE OF ALLOTMENT:
September 06, 2022
FUND MANAGER(S):
Rajasa Kakulavarapu (Equity)
Venkatesh Sanjeevi (w.e.f. October 4, 2024)
Chandni Gupta (w.e.f. March 07, 2024)
Anuj Tagra (w.e.f. March 07, 2024)
Rahul Goswami (Debt) (w.e.f. November 10, 2023)
Sandeep Manam
(dedicated for making investments for Foreign Securities)
BENCHMARK:
NIFTY 50 Hybrid Composite Debt 50:50 Index
| TURNOVER | |
| Total Portfolio Turnover$ | 270.68% |
| Portfolio Turnover (Equity)** | 306.50% |
| $ Includes fixed income securities and equity derivatives ** Computed for equity portion of the portfolio including equity derivatives | |
| MATURITY & YIELD# | |
| RESIDUAL MATURITY / AVERAGE MATURITY | 5.56 years |
| ANNUALISED PORTFOLIO YTM# | 7.88% |
| MODIFIED DURATION | 3.31 years |
| MACAULAY DURATION | 3.48 years |
| #Yields of all securities are in annualised terms # Calculated based on debt holdings in the portfolio | |
# The above ratio includes the GST on Investment Management Fees. The rates specified are the actual expenses charged as at the end of the month. MINIMUM INVESTMENT/
MULTIPLES FOR NEW INVESTORS:
Rs 5000/1 MINIMUM INVESTMENT FOR SIP
Rs 500/1
ADDITIONAL INVESTMENT/
MULTIPLES FOR EXISTING INVESTORS:
Rs1000/1 LOAD STRUCTURE:
| Entry Load | : | Nil |
| Exit Load (for each purchase of Units) | : |
Upto 10% of the Units may be redeemed without any exit
load within 1 year from the date of allotment.
Any redemption in excess of the above limit shall be subject
to the following exit load: 1.00% - if redeemed on or before 1 year from the date of allotment Nil - if redeemed after 1 year from the date of allotment |
| Different plans have a different expense structure | ||
MARCH 31, 2026
| Growth Plan | Rs 13.4502 |
| IDCW Plan | Rs 12.5093 |
| Direct - Growth Plan | Rs 14.2540 |
| Direct - IDCW Plan | Rs 12.7241 |
| As per the addendum dated March 31, 2021, the Dividend Plan has been renamed to Income Distribution cum capital withdrawal (IDCW) Plan with effect from April 1, 2021 | |
| FUND SIZE (AUM) | |
| Month End | Rs2662.52 crores |
| Monthly Average | Rs2750.98 crores |
| Outstanding exposure in derivative instruments | Rs171.23 crores |
| Outstanding derivative exposure | 6.43% |
| Company Name | No. of shares | Market Value Rs Lakhs |
% of Assets | Outstanding derivative exposure as % to net assets Long / (Short ) |
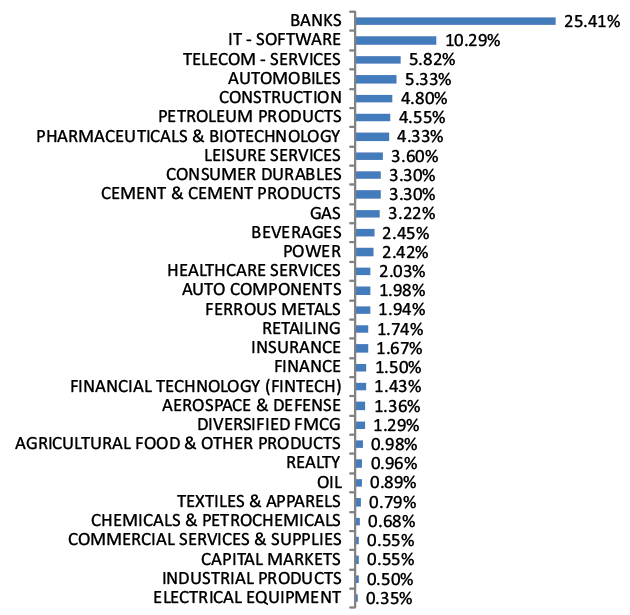
| Aerospace & Defense | ||||
| Bharat Electronics Ltd | 7,80,300 | 3,126.27 | 1.17 | -0.22 |
| Hindustan Aeronautics Ltd | 60,000 | 2,092.32 | 0.79 | |
| Agricultural Food & Other Products | ||||
| Marico Ltd | 4,30,000 | 3,164.59 | 1.19 | |
| Agricultural, Commercial & Construction Vehicles | ||||
| Ashok Leyland Ltd | 16,50,000 | 2,543.15 | 0.96 | |
| Auto Components | ||||
| ZF Commercial Vehicle Control Systems India Ltd | 10,539 | 1,451.01 | 0.54 | |
| Amara Raja Energy And Mobility Ltd | 1,43,204 | 962.98 | 0.36 | |
| Automobiles | ||||
| Mahindra & Mahindra Ltd | 1,44,500 | 4,269.54 | 1.60 | |
| Maruti Suzuki India Ltd | 13,000 | 1,599.78 | 0.60 | |
| Banks | ||||
| HDFC Bank Ltd* | 21,30,000 | 15,582.02 | 5.85 | -1.37 |
| ICICI Bank Ltd* | 10,70,000 | 12,903.13 | 4.85 | -0.32 |
| State Bank of India* | 8,19,500 | 8,026.18 | 3.01 | |
| Axis Bank Ltd* | 6,70,000 | 7,780.71 | 2.92 | |
| Capital Markets | ||||
| Angel One Ltd | 5,00,010 | 1,137.67 | 0.43 | |
| Cement & Cement Products | ||||
| Ultratech Cement Ltd | 50,000 | 5,372.50 | 2.02 | -0.57 |
| Construction | ||||
| Larsen & Toubro Ltd* | 2,19,250 | 7,682.74 | 2.89 | -0.42 |
| Consumer Durables | ||||
| Amber Enterprises India Ltd | 33,000 | 2,161.17 | 0.81 | |
| Diversified FMCG | ||||
| Hindustan Unilever Ltd | 75,000 | 1,541.40 | 0.58 | |
| Electrical Equipment | ||||
| ABB India Ltd | 15,000 | 891.23 | 0.33 | |
| Ferrous Metals | ||||
| Tata Steel Ltd | 29,76,500 | 5,710.71 | 2.14 | -0.68 |
| Finance | ||||
| Cholamandalam Investment and Finance Co Ltd | 2,37,500 | 3,217.41 | 1.21 | |
| Tata Capital Ltd | 5,00,000 | 1,525.00 | 0.57 | |
| PNB Housing Finance Ltd | 1,78,325 | 1,346.44 | 0.51 | |
| Financial Technology (Fintech) | ||||
| PB Fintech Ltd | 1,80,165 | 2,572.40 | 0.97 | -0.07 |
| Food Products | ||||
| Britannia Industries Ltd | 60,000 | 3,253.80 | 1.22 | |
| Kwality Wall’s India Ltd | 87,800 | 19.73 | 0.01 | |
| Healthcare Services | ||||
| Apollo Hospitals Enterprise Ltd | 65,000 | 4,822.35 | 1.81 | -0.42 |
| Metropolis Healthcare Ltd | 5,62,500 | 2,441.25 | 0.92 | |
| Industrial Products | ||||
| Kirloskar Oil Engines Ltd | 1,90,000 | 2,524.91 | 0.95 | |
| Insurance | ||||
| ICICI Lombard General Insurance Co Ltd | 1,30,000 | 2,223.78 | 0.84 | |
| HDFC Life Insurance Co Ltd | 3,00,000 | 1,771.80 | 0.67 | -0.16 |
| Canara HSBC Life Insurance Co Ltd | 10,84,748 | 1,525.70 | 0.57 | |
| IT - Software | ||||
| Infosys Ltd | 4,10,000 | 5,127.46 | 1.93 | |
| HCL Technologies Ltd | 3,55,000 | 4,762.68 | 1.79 | |
| Leisure Services | ||||
| Lemon Tree Hotels Ltd | 13,00,000 | 1,305.46 | 0.49 | |
| Non - Ferrous Metals | ||||
| Hindalco Industries Ltd | 1,70,000 | 1,503.57 | 0.56 | |
| Oil | ||||
| Oil & Natural Gas Corporation Ltd | 14,567 | 41.46 | 0.02 | |
| Petroleum Products | ||||
| Reliance Industries Ltd* | 7,90,000 | 10,616.81 | 3.99 | -0.38 |
| Pharmaceuticals & Biotechnology | ||||
| Sun Pharmaceutical Industries Ltd | 1,95,000 | 3,426.54 | 1.29 | -0.23 |
| Eris Lifesciences Ltd | 1,50,000 | 1,945.80 | 0.73 | |
| Power | ||||
| NTPC Ltd* | 15,80,000 | 5,856.27 | 2.20 | -0.06 |
| CESC Ltd | 16,00,000 | 2,402.72 | 0.90 | |
| Realty | ||||
| Phoenix Mills Ltd | 2,00,000 | 3,012.60 | 1.13 | |
| Retailing | ||||
| Eternal Ltd | 19,10,000 | 4,373.52 | 1.64 | -0.10 |
| V-Mart Retail Ltd | 2,50,280 | 1,194.34 | 0.45 | |
| Telecom - Services | ||||
| Bharti Airtel Ltd* | 6,49,000 | 11,567.78 | 4.34 | -1.44 |
| Transport Services | ||||
| Interglobe Aviation Ltd | 80,000 | 3,154.80 | 1.18 | |
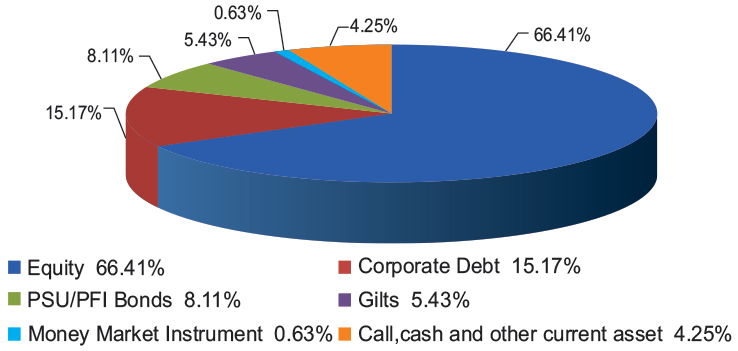
| Total Equity Holdings | 1,75,535.45 | 65.93 | -6.43 | |
| Company Name | Company Ratings | Market Value (including accrued interest, if any) (Rs. in Lakhs) | % of Assets | |
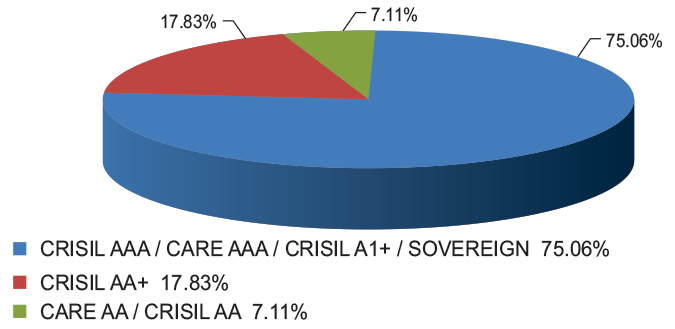
| Jubilant Bevco Ltd* | CRISIL AA | 12,905.18 | 4.85 | |
| Jubilant Beverages Ltd* | CRISIL AA | 8,010.19 | 3.01 | |
| Bharti Telecom Ltd | CRISIL AAA | 5,766.98 | 2.17 | |
| RJ Corp Ltd | CRISIL AAA | 5,387.19 | 2.02 | |
| Poonawalla Fincorp Ltd | CRISIL AAA | 5,346.39 | 2.01 | |
| Summit Digitel Infrastructure Ltd | CRISIL AAA | 5,115.56 | 1.92 | |
| Kotak Mahindra Prime Ltd | CRISIL AAA | 2,580.78 | 0.97 | |
| Embassy Office Parks Reit | CRISIL AAA | 2,480.02 | 0.93 | |
| Total Corporate Debt | 47,592.28 | 17.87 | ||
| National Bank For Agriculture & Rural Development | CRISIL AAA | 4,106.92 | 1.54 | |
| REC Ltd | CRISIL AAA | 3,923.52 | 1.47 | |
| Power Finance Corporation Ltd | CRISIL AAA | 2,961.75 | 1.11 | |
| Small Industries Development Bank Of India | CARE AAA | 1,040.94 | 0.39 | |
| India Infrastructure Finance Co Ltd | CARE AAA | 1,027.00 | 0.39 | |
| Total PSU/PFI Bonds | 13,060.13 | 4.91 | ||
| 6.90% GOI 2065 (15-APR-2065) | SOVEREIGN | 4,675.45 | 1.76 | |
| 7.66% Maharashtra SDL (04-Mar-2047) | SOVEREIGN | 3,741.59 | 1.41 | |
| 7.30% Uttarakhand SDL (01-Oct-2032) | SOVEREIGN | 3,584.37 | 1.35 | |
| 5.63% GOI 2026 (12-APR-2026) | SOVEREIGN | 2,566.32 | 0.96 | |
| 7.62% Punjab SDL (28-Jan-2033) | SOVEREIGN | 2,517.06 | 0.95 | |
| 7.64% Uttarakhand SDL (24-Dec-2032) | SOVEREIGN | 2,402.81 | 0.90 | |
| 7.06% GOI 2028 (10-APR-2028) | SOVEREIGN | 2,091.51 | 0.79 | |
| 7.48% Punjab SDL (14-Jan-2031) | SOVEREIGN | 2,029.58 | 0.76 | |
| 7.65% Bihar SDL (24-Dec-2033) | SOVEREIGN | 1,592.78 | 0.60 | |
| 7.38% GOI 2027 (20-JUN-2027) | SOVEREIGN | 498.59 | 0.19 | |
| 7.32% Chhattisgarh SDL (05-Mar-2037) | SOVEREIGN | 50.94 | 0.02 | |
| 7.32% West Bengal SDL (05-Mar-2038) | SOVEREIGN | 48.38 | 0.02 | |
| 7.08% Kerala SDL (26-Mar-2040) | SOVEREIGN | 13.93 | 0.01 | |
| Total Gilts | 25,813.32 | 9.70 | ||
| Total Debt Holdings | 86,465.73 | 32.48 | ||
| Total Holdings | 2,62,001.18 | 98.40 | ||
| Margin on Derivatives | 2,439.57 | 0.92 | ||
| Call,cash and other current asset | 1,811.66 | 0.68 | ||
| Total Asset | 2,66,252.41 | 100.00 | ||
| * Top 10 holdings | ||||
@ TREPs /Reverse Repo : 2.14%, Others (Cash/ Subscription receivable/ Redemption payable/ Receivables on sale/Payable on Purchase/ Other Receivable / Other Payable) : -1.46%