
Franklin India Large Cap Fund$$
(Erstwhile Franklin India Bluechip Fund)As on March 31, 2026
|
Franklin India Large Cap Fund$$ (Erstwhile Franklin India Bluechip Fund) As on March 31, 2026 |
|


|
TYPE OF SCHEME
Large-cap Fund- An open ended equity scheme predominantly investing in large cap stocks
SCHEME CATEGORY
Large Cap Fund
SCHEME CHARACTERISTICS
Min 80% Large Caps
INVESTMENT OBJECTIVE
The investment objective of the scheme is to generate long-term capital appreciation by actively managing a portfolio of equity and equity related securities. The Scheme will invest in a range of companies, with a bias towards large cap companies.
DATE OF ALLOTMENT:
December 1, 1993
FUND MANAGER(S):
Venkatesh Sanjeevi, Ajay Argal (w.e.f December 1, 2023)
Sandeep Manam (dedicated for making investments for Foreign Securities)
BENCHMARK:
Nifty 100
EXPENSE RATIO#: 1.88%
EXPENSE RATIO# (DIRECT) : 1.17%
# The above ratio includes the GST on Investment Management Fees. The rates specified are the actual expenses charged as at the end of the month. MINIMUM INVESTMENT/
MULTIPLES FOR NEW INVESTORS:
Rs 5000/1 MINIMUM INVESTMENT FOR SIP
Rs 500/1 ADDITIONAL INVESTMENT/
MULTIPLES FOR EXISTING INVESTORS:
Rs1000/1 LOAD STRUCTURE:
Different plans have a different expense
structure
Large-cap Fund- An open ended equity scheme predominantly investing in large cap stocks
SCHEME CATEGORY
Large Cap Fund
SCHEME CHARACTERISTICS
Min 80% Large Caps
INVESTMENT OBJECTIVE
The investment objective of the scheme is to generate long-term capital appreciation by actively managing a portfolio of equity and equity related securities. The Scheme will invest in a range of companies, with a bias towards large cap companies.
DATE OF ALLOTMENT:
December 1, 1993
FUND MANAGER(S):
Venkatesh Sanjeevi, Ajay Argal (w.e.f December 1, 2023)
Sandeep Manam (dedicated for making investments for Foreign Securities)
BENCHMARK:
Nifty 100
| TURNOVER: | |
| Portfolio Turnover | 66.56% |
| VOLATILITY MEASURES (3 YEARS): | |
| Standard Deviation | 3.77% |
| Beta | 0.89 |
| Sharpe Ratio* | 0.32 |
| * Annualised. Risk-free rate assumed to be 6.98% (FBIL OVERNIGHT MIBOR) | |
# The above ratio includes the GST on Investment Management Fees. The rates specified are the actual expenses charged as at the end of the month. MINIMUM INVESTMENT/
MULTIPLES FOR NEW INVESTORS:
Rs 5000/1 MINIMUM INVESTMENT FOR SIP
Rs 500/1 ADDITIONAL INVESTMENT/
MULTIPLES FOR EXISTING INVESTORS:
Rs1000/1 LOAD STRUCTURE:
| Entry Load | : | Nil |
| Exit Load (for each purchase of Units) | : | In respect of each purchase of Units - 1% if the Units are redeemed/switched-out within one year of allotment |
MARCH 31, 2026
| Growth Plan | Rs924.9896 |
| IDCW Plan | Rs38.8414 |
| Direct - Growth Plan | Rs1029.3413 |
| Direct - IDCW Plan | Rs45.2613 |
| As per the addendum dated March 31, 2021, the Dividend Plan has been renamed to Income Distribution cum capital withdrawal (IDCW) Plan with effect from April 1, 2021 | |
| FUND SIZE (AUM) | |
| Month End | Rs6821.18 crores |
| Monthly Average | Rs7159.15 crores |
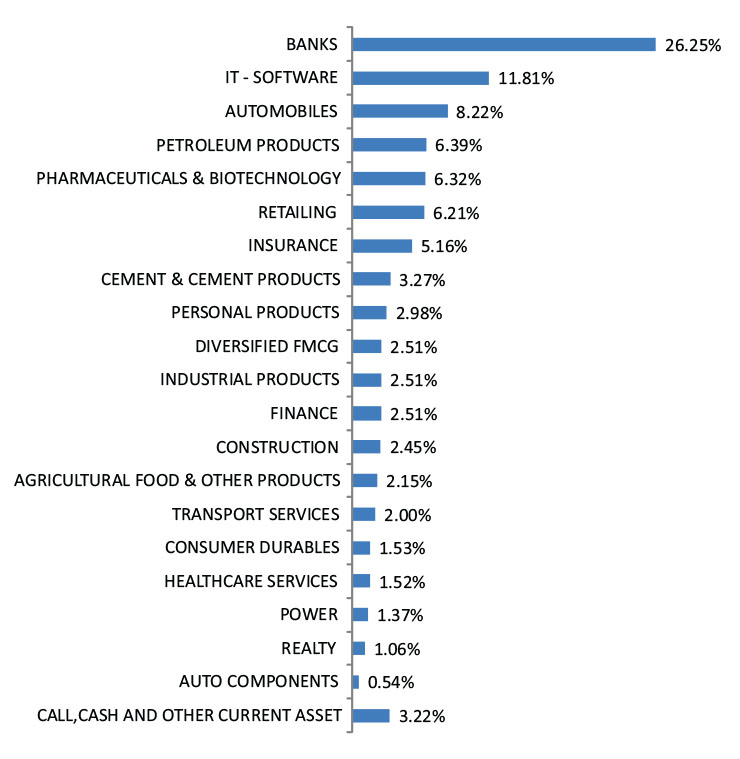
| Company Name | No. of shares | Market Value Rs Lakhs | % of assets | |
| Agricultural Food & Other Products | ||||
| Tata Consumer Products Ltd | 6,70,306 | 6,802.27 | 1.00 | |
| Agricultural, Commercial & Construction Vehicles | ||||
| Tata Motors Ltd | 24,86,790 | 9,817.85 | 1.44 | |
| Automobiles | ||||
| Mahindra & Mahindra Ltd* | 8,92,469 | 26,369.78 | 3.87 | |
| Hyundai Motor India Ltd | 86,586 | 1,539.50 | 0.23 | |
| Banks | ||||
| ICICI Bank Ltd* | 47,71,368 | 57,537.93 | 8.44 | |
| HDFC Bank Ltd* | 63,49,824 | 46,452.14 | 6.81 | |
| Kotak Mahindra Bank Ltd* | 85,68,589 | 30,281.39 | 4.44 | |
| Axis Bank Ltd* | 23,13,964 | 26,872.06 | 3.94 | |
| State Bank of India | 16,44,911 | 16,110.26 | 2.36 | |
| Beverages | ||||
| United Spirits Ltd | 5,44,782 | 6,639.80 | 0.97 | |
| Cement & Cement Products | ||||
| Ultratech Cement Ltd | 92,958 | 9,988.34 | 1.46 | |
| Construction | ||||
| Larsen & Toubro Ltd* | 5,94,349 | 20,826.58 | 3.05 | |
| Consumer Durables | ||||
| Asian Paints Ltd | 5,99,286 | 12,975.74 | 1.90 | |
| Dixon Technologies (India) Ltd | 73,796 | 7,138.29 | 1.05 | |
| Crompton Greaves Consumer Electricals Ltd | 27,70,210 | 6,194.19 | 0.91 | |
| Titan Co Ltd | 85,710 | 3,386.74 | 0.50 | |
| Diversified FMCG | ||||
| Hindustan Unilever Ltd | 6,66,157 | 13,690.86 | 2.01 | |
| Electrical Equipment | ||||
| ABB India Ltd | 2,42,852 | 14,429.05 | 2.12 | |
| Financial Technology (Fintech) | ||||
| PB Fintech Ltd | 7,58,975 | 10,836.65 | 1.59 | |
| Healthcare Services | ||||
| Apollo Hospitals Enterprise Ltd | 1,90,704 | 14,148.33 | 2.07 | |
| Max Healthcare Institute Ltd | 9,63,694 | 9,273.63 | 1.36 | |
| Insurance | ||||
| HDFC Life Insurance Co Ltd | 18,98,456 | 11,212.28 | 1.64 | |
| SBI Life Insurance Co Ltd | 5,75,972 | 10,236.75 | 1.50 | |
| IT - Services | ||||
| Cognizant Technology Solutions Corp., A (USA) | 1,78,153 | 10,274.34 | 1.51 | |
| IT - Software | ||||
| HCL Technologies Ltd* | 21,38,646 | 28,692.07 | 4.21 | |
| Infosys Ltd* | 14,13,499 | 17,677.22 | 2.59 | |
| Tata Consultancy Services Ltd | 1,71,367 | 4,042.38 | 0.59 | |
| Persistent Systems Ltd | 80,273 | 3,915.07 | 0.57 | |
| Hexaware Technologies Ltd | 5,99,965 | 2,549.85 | 0.37 | |
| Non - Ferrous Metals | ||||
| Hindalco Industries Ltd | 12,42,521 | 10,989.48 | 1.61 | |
| Oil | ||||
| Oil & Natural Gas Corporation Ltd | 12,36,385 | 3,519.37 | 0.52 | |
| Personal Products | ||||
| Godrej Consumer Products Ltd | 9,57,559 | 9,430.04 | 1.38 | |
| Petroleum Products | ||||
| Reliance Industries Ltd* | 31,38,273 | 42,175.25 | 6.18 | |
| Pharmaceuticals & Biotechnology | ||||
| Sun Pharmaceutical Industries Ltd | 9,78,200 | 17,188.93 | 2.52 | |
| J.B. Chemicals & Pharmaceuticals Ltd | 7,77,885 | 16,058.66 | 2.35 | |
| Torrent Pharmaceuticals Ltd | 3,26,893 | 13,795.54 | 2.02 | |
| Divi's Laboratories Ltd | 1,38,483 | 8,235.58 | 1.21 | |
| Power | ||||
| Tata Power Co Ltd | 39,23,032 | 14,858.48 | 2.18 | |
| Power Grid Corporation of India Ltd | 45,92,912 | 13,599.61 | 1.99 | |
| Realty | ||||
| Oberoi Realty Ltd | 4,85,067 | 6,883.10 | 1.01 | |
| Brigade Enterprises Ltd | 5,94,251 | 3,867.09 | 0.57 | |
| Retailing | ||||
| Eternal Ltd* | 1,49,50,412 | 34,233.45 | 5.02 | |
| Info Edge (India) Ltd | 9,57,094 | 9,261.80 | 1.36 | |
| Vishal Mega Mart Ltd | 75,11,711 | 7,909.83 | 1.16 | |
| Swiggy Ltd | 25,92,069 | 6,740.68 | 0.99 | |
| Transport Infrastructure | ||||
| JSW Infrastructure Ltd | 22,81,068 | 5,492.81 | 0.81 | |
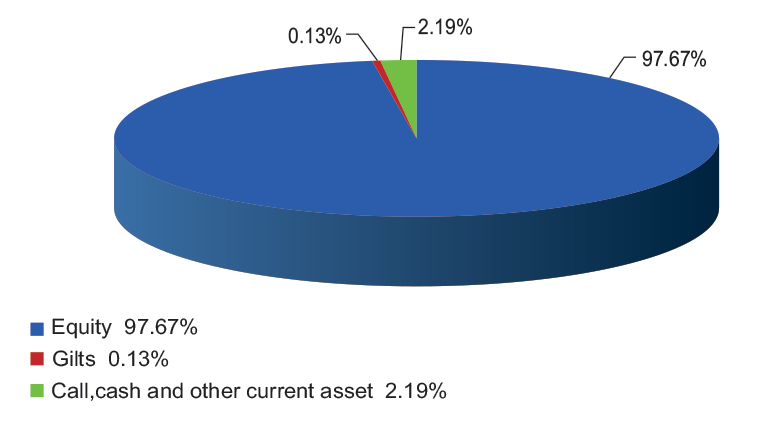
| Total Equity Holdings | 6,64,151.05 | 97.37 | ||
| Company Name | Company Ratings | Market Value (including accrued interest, if any) (Rs. in Lakhs) | % of Assets | |
| 91 DTB (17-APR-2026) | SOVEREIGN | 997.68 | 0.15 | |
| Total Gilts | 997.68 | 0.15 | ||
| Total Debt Holdings | 997.68 | 0.15 | ||
| Total Holdings | 6,65,148.73 | 97.51 | ||
| Call,cash and other current asset | 16,969.66 | 2.49 | ||
| Total Asset | 6,82,118.39 | 100.00 | ||
| * Top 10 holdings | ||||
@ TREPs /Reverse Repo : 1.75%, Others (Cash/ Subscription receivable/ Redemption payable/ Receivables on sale/Payable on Purchase/ Other Receivable / Other Payable) : 0.74%
$$ - Franklin India Bluechip Fund has been renamed as Franklin India Large Cap Fund effective July 11, 2025
Please click here for Product Label & Benchmark Risk-o-meter.