Franklin India Equity Savings Fund
As on April 30, 2026
|
Franklin India Equity Savings Fund
As on April 30, 2026 |
|


|
TYPE OF SCHEME
An open-ended scheme investing in equity,arbitrage and fixed income
SCHEME CATEGORY
Equity Savings Fund
SCHEME CHARACTERISTICS
65-90% Equity, 10-35% Debt
INVESTMENT OBJECTIVE
The Scheme intends to generate long-term capital appreciation by investing a portion of the Scheme’s assets in equity and equity related instruments. The Scheme also intends to generate income through investments in fixed income securities and using arbitrage and other derivative Strategies. There can be no assurance that the investment objective of the scheme will be realized.
DATE OF ALLOTMENT:
August 27, 2018
FUND MANAGER(S):
Rajasa Kakulavarapu (Equity)
Venkatesh Sanjeevi (w.e.f. October 4, 2024)
Anuj Tagra (w.e.f. April 30, 2024) (Fixed Income)
Rohan Maru (w.e.f. October 10, 2024)
Sandeep Manam
(dedicated for making investments for Foreign Securities)
BENCHMARK:
Nifty Equity Savings Index
BASE EXPENSE RATIO#: 0.96%
BASE EXPENSE RATIO# (DIRECT) : 0.31%
#Base Expense Ratio (BER) is the actual expense ratio charged as per the AUM slabs and within the BER limits prescribed in Regulation 66 of SEBI MF regulations. BER excludes brokerage and transaction costs incurred towards execution of trades and the applicable statutory levies as on that date. Brokerage and transaction costs incurred towards execution of trades and statutory levies are charged, at actuals, and is over and above the BER.
For Total Expense Ratio (TER) and break up of TER i.e., BER, brokerage and transaction costs and statutory levies, please refer to daily TER disclosures on our website www.franklintempletonindia.com. For detailed understanding of TER, please refer to the TER note on our website. MINIMUM INVESTMENT/
MULTIPLES FOR NEW INVESTORS:
Plan A Rs 5000/1 MINIMUM INVESTMENT FOR SIP
Rs 500/1
ADDITIONAL INVESTMENT/
MULTIPLES FOR EXISTING INVESTORS:
Plan A Rs1000/1 LOAD STRUCTURE:
* This no load redemption limit is applicable on a yearly basis (from
the date of allotment of such units) and the limit not availed during
a year shall not be clubbed or carried forward to the next year
Different plans have a different expense structure
An open-ended scheme investing in equity,arbitrage and fixed income
SCHEME CATEGORY
Equity Savings Fund
SCHEME CHARACTERISTICS
65-90% Equity, 10-35% Debt
INVESTMENT OBJECTIVE
The Scheme intends to generate long-term capital appreciation by investing a portion of the Scheme’s assets in equity and equity related instruments. The Scheme also intends to generate income through investments in fixed income securities and using arbitrage and other derivative Strategies. There can be no assurance that the investment objective of the scheme will be realized.
DATE OF ALLOTMENT:
August 27, 2018
FUND MANAGER(S):
Rajasa Kakulavarapu (Equity)
Venkatesh Sanjeevi (w.e.f. October 4, 2024)
Anuj Tagra (w.e.f. April 30, 2024) (Fixed Income)
Rohan Maru (w.e.f. October 10, 2024)
Sandeep Manam
(dedicated for making investments for Foreign Securities)
BENCHMARK:
Nifty Equity Savings Index
| TURNOVER | |
| Total Portfolio Turnover$ | 668.01% |
| Portfolio Turnover (Equity)** | 848.44% |
| $ Includes fixed income securities and equity derivatives ** Computed for equity portion of the portfolio including equity derivatives | |
| MATURITY & YIELD$ | |
| RESIDUAL MATURITY / AVERAGE MATURITY | 5.08 years |
| ANNUALISED PORTFOLIO YTM# | 7.11% |
| MODIFIED DURATION | 3.12 years |
| MACAULAY DURATION | 3.28 years |
| #Yields of all securities are in annualised terms $ Calculated based on debt holdings in the portfolio | |
#Base Expense Ratio (BER) is the actual expense ratio charged as per the AUM slabs and within the BER limits prescribed in Regulation 66 of SEBI MF regulations. BER excludes brokerage and transaction costs incurred towards execution of trades and the applicable statutory levies as on that date. Brokerage and transaction costs incurred towards execution of trades and statutory levies are charged, at actuals, and is over and above the BER.
For Total Expense Ratio (TER) and break up of TER i.e., BER, brokerage and transaction costs and statutory levies, please refer to daily TER disclosures on our website www.franklintempletonindia.com. For detailed understanding of TER, please refer to the TER note on our website. MINIMUM INVESTMENT/
MULTIPLES FOR NEW INVESTORS:
Plan A Rs 5000/1 MINIMUM INVESTMENT FOR SIP
Rs 500/1
ADDITIONAL INVESTMENT/
MULTIPLES FOR EXISTING INVESTORS:
Plan A Rs1000/1 LOAD STRUCTURE:
| Plan A Entry Load | : | Nil |
| Exit Load (for each purchase of Units) | : | Nil (effective October 11, 2021) |
Different plans have a different expense structure
NAV AS OF APRIL 30, 2026
| Growth Plan | Rs 16.7095 |
| IDCW Plan | Rs 13.6950 |
| Monthly IDCW Plan | Rs 13.1556 |
| Quarterly IDCW Plan | Rs 12.2684 |
| Direct - Growth Plan | Rs 18.3760 |
| Direct - IDCW Plan | Rs 15.0000 |
| Direct - Monthly IDCW Plan | Rs 13.6833 |
| Direct - Quarterly IDCW Plan | Rs 13.8697 |
| As per the addendum dated March 31, 2021, the Dividend Plan has been renamed to Income Distribution cum capital withdrawal (IDCW) Plan with effect from April 1, 2021 | |
| FUND SIZE (AUM) | |
| Month End | Rs 633.18 crores |
| Monthly Average | Rs 637.00 crores |
| Outstanding exposure in derivative instruments | Rs 315.38 crores |
| Outstanding derivative exposure | 49.81% |
| Company Name | No. of shares | Market Value Rs Lakhs |
% of Assets | Outstanding derivative exposure as % to net assets Long / (Short ) |
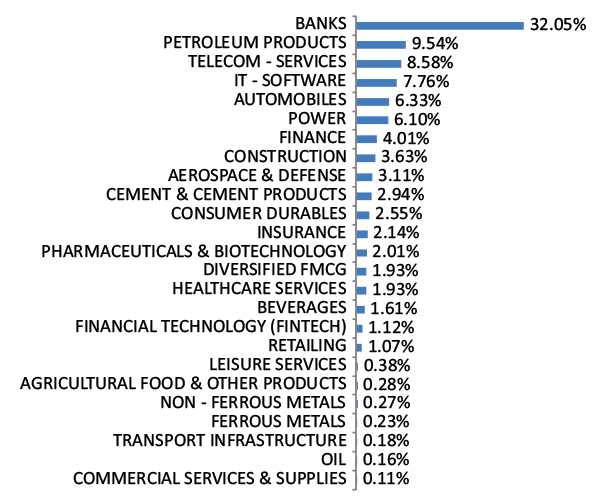
| Aerospace & Defense | ||||
| Hindustan Aeronautics Ltd | 46,500 | 2,017.54 | 3.19 | -2.89 |
| Bharat Electronics Ltd | 26,000 | 112.14 | 0.18 | |
| Agricultural Food & Other Products | ||||
| Marico Ltd | 33,000 | 255.75 | 0.40 | |
| Automobiles | ||||
| Mahindra & Mahindra Ltd* | 68,900 | 2,134.18 | 3.37 | -2.76 |
| TVS Motor Co Ltd (Non- Convertible Preference Shares) | 65,00,000 | 663.00 | 1.05 | |
| Maruti Suzuki India Ltd | 2,500 | 332.85 | 0.53 | -0.11 |
| Tata Motors Passenger Vehicles Ltd | 6,400 | 21.86 | 0.03 | -0.03 |
| Banks | ||||
| Axis Bank Ltd* | 2,94,750 | 3,738.31 | 5.90 | -5.21 |
| ICICI Bank Ltd* | 1,81,900 | 2,298.12 | 3.63 | -2.42 |
| Kotak Mahindra Bank Ltd* | 5,50,000 | 2,108.15 | 3.33 | -3.35 |
| HDFC Bank Ltd | 1,43,000 | 1,103.53 | 1.74 | |
| RBL Bank Ltd | 2,79,400 | 940.32 | 1.49 | -1.49 |
| Bank of Baroda | 2,63,250 | 693.56 | 1.10 | -1.10 |
| State Bank of India | 45,200 | 482.94 | 0.76 | |
| AU Small Finance Bank Ltd | 35,000 | 355.58 | 0.56 | -0.56 |
| Bandhan Bank Ltd | 1,40,400 | 280.41 | 0.44 | -0.45 |
| Yes Bank Ltd | 2,48,800 | 49.59 | 0.08 | -0.08 |
| Cement & Cement Products | ||||
| Ultratech Cement Ltd | 8,000 | 926.88 | 1.46 | -0.92 |
| Ambuja Cements Ltd | 76,650 | 340.48 | 0.54 | -0.54 |
| Construction | ||||
| Larsen & Toubro Ltd | 30,400 | 1,220.26 | 1.93 | -0.98 |
| Consumer Durables | ||||
| Titan Co Ltd | 41,125 | 1,803.41 | 2.85 | -2.86 |
| Diversified FMCG | ||||
| ITC Ltd | 1,12,000 | 352.69 | 0.56 | -0.56 |
| Hindustan Unilever Ltd | 13,200 | 297.12 | 0.47 | -0.04 |
| Ferrous Metals | ||||
| Tata Steel Ltd | 93,500 | 197.62 | 0.31 | -0.31 |
| JSW Steel Ltd | 1,350 | 17.07 | 0.03 | -0.03 |
| Finance | ||||
| Jio Financial Services Ltd | 3,99,500 | 984.25 | 1.55 | -1.56 |
| Power Finance Corporation Ltd | 1,23,500 | 553.77 | 0.87 | -0.88 |
| Cholamandalam Investment and Finance Co Ltd | 27,000 | 421.98 | 0.67 | |
| Bajaj Finserv Ltd | 23,000 | 401.86 | 0.63 | -0.64 |
| Bajaj Finance Ltd | 30,000 | 281.10 | 0.44 | -0.45 |
| Financial Technology (Fintech) | ||||
| PB Fintech Ltd | 20,000 | 333.24 | 0.53 | |
| Food Products | ||||
| Britannia Industries Ltd | 8,000 | 458.08 | 0.72 | |
| Healthcare Services | ||||
| Apollo Hospitals Enterprise Ltd | 15,350 | 1,172.20 | 1.85 | -1.00 |
| Insurance | ||||
| HDFC Life Insurance Co Ltd | 1,59,500 | 936.11 | 1.48 | -0.91 |
| SBI Life Insurance Co Ltd | 11,625 | 211.46 | 0.33 | -0.33 |
| ICICI Lombard General Insurance Co Ltd | 8,000 | 141.06 | 0.22 | |
| Max Financial Services Ltd | 8,000 | 126.86 | 0.20 | -0.20 |
| IT - Software | ||||
| Infosys Ltd | 56,604 | 668.95 | 1.06 | |
| HCL Technologies Ltd | 28,000 | 335.75 | 0.53 | |
| Coforge Ltd | 3,375 | 40.36 | 0.06 | -0.06 |
| Petroleum Products | ||||
| Reliance Industries Ltd* | 2,20,000 | 3,147.76 | 4.97 | -3.88 |
| Hindustan Petroleum Corporation Ltd | 81,000 | 303.39 | 0.48 | -0.48 |
| Pharmaceuticals & Biotechnology | ||||
| Cipla Ltd | 29,250 | 383.06 | 0.60 | -0.61 |
| Mankind Pharma Ltd | 12,500 | 280.84 | 0.44 | |
| Sun Pharmaceutical Industries Ltd | 14,000 | 253.16 | 0.40 | -0.40 |
| Power | ||||
| NTPC Ltd* | 7,20,000 | 2,873.88 | 4.54 | -3.30 |
| Tata Power Co Ltd | 2,26,200 | 1,005.57 | 1.59 | -1.60 |
| Power Grid Corporation of India Ltd | 1,34,900 | 429.45 | 0.68 | -0.68 |
| Realty | ||||
| Godrej Properties Ltd | 17,050 | 312.90 | 0.49 | -0.50 |
| Retailing | ||||
| Eternal Ltd | 2,10,000 | 518.76 | 0.82 | |
| Telecom - Services | ||||
| Bharti Airtel Ltd* | 1,43,300 | 2,703.78 | 4.27 | -3.07 |
| Vodafone Idea Ltd | 96,49,125 | 986.14 | 1.56 | -1.57 |
| Indus Towers Ltd | 1,49,600 | 613.29 | 0.97 | -0.97 |
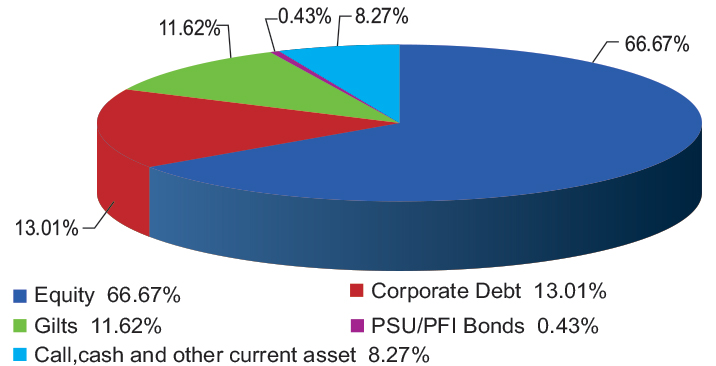
| Total Equity Holdings | 43,622.36 | 68.89 | -49.81 | |
| Company Name | Company Ratings | Market Value (including accrued interest, if any) (Rs. in Lakhs) | % of Assets | |
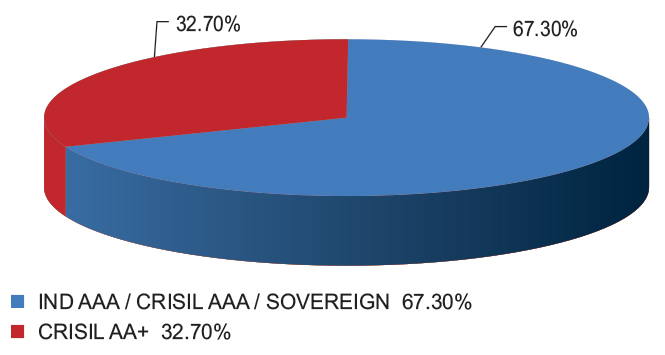
| Jubilant Bevco Ltd* | CRISIL AA | 2,533.54 | 4.00 | |
| Embassy Office Parks Reit | CRISIL AAA | 1,495.97 | 2.36 | |
| Poonawalla Fincorp Ltd | CRISIL AAA | 996.19 | 1.57 | |
| Jubilant Beverages Ltd | CRISIL AA | 866.10 | 1.37 | |
| Total Corporate Debt | 5,891.80 | 9.31 | ||
| REC Ltd | CRISIL AAA | 225.32 | 0.36 | |
| Total PSU/PFI Bonds | 225.32 | 0.36 | ||
| 7.37% GOI 2028 (23-OCT-2028)* | SOVEREIGN | 2,561.61 | 4.05 | |
| 7.66% Maharashtra SDL (04-Mar-2047)* | SOVEREIGN | 2,240.66 | 3.54 | |
| 7.30% Uttarakhand SDL (01-Oct-2032) | SOVEREIGN | 1,484.80 | 2.35 | |
| 7.48% Punjab SDL (14-Jan-2031) | SOVEREIGN | 1,022.36 | 1.61 | |
| 7.06% GOI 2028 (10-APR-2028) | SOVEREIGN | 1,019.31 | 1.61 | |
| 6.90% GOI 2065 (15-APR-2065) | SOVEREIGN | 263.79 | 0.42 | |
| Total Gilts | 8,592.54 | 13.57 | ||
| Total Debt Holdings | 14,709.65 | 23.23 | ||
| Total Holdings | 58,332.01 | 92.13 | ||
| Margin on Derivatives | 1,789.41 | 2.83 | ||
| Call,cash and other current asset | 3,196.10 | 5.05 | ||
| Total Asset | 63,317.52 | 100.00 | ||
| * Top 10 holdings | ||||
@ TREPs /Reverse Repo : 2.59%, Others (Cash/ Subscription receivable/ Redemption payable/ Receivables on sale/Payable on Purchase/ Other Receivable / Other Payable) : 2.46%