
Franklin India Flexi Cap Fund
As on February 27, 2026
(Erstwhile Franklin India Equity Fund)
This is a Simple and Performing scheme which is eligible for distribution by new cadre of distributors.
|
Franklin India Flexi Cap Fund
(Erstwhile Franklin India Equity Fund) |
|


|
TYPE OF SCHEME
Flexi cap Fund- An open-ended dynamic equity scheme investing across large, mid and small cap stocks
SCHEME CATEGORY
Flexi Cap Fund
SCHEME CHARACTERISTICS
Min 65% Equity across Large, Mid & Small Caps
INVESTMENT OBJECTIVE
The investment objective of this scheme is to provide growth of capital plus regular dividend through a diversified portfolio of equities, fixed income securities and money market instruments.
DATE OF ALLOTMENT:
September 29, 1994
FUND MANAGER(S):
R. Janakiraman, Rajasa Kakulavarapu (w.e.f December 1, 2023) &
Sandeep Manam (dedicated for making investments for Foreign Securities)
BENCHMARK:
Nifty 500
EXPENSE RATIO#: 1.69%
EXPENSE RATIO# (DIRECT) : 0.89%
# The above ratio includes the GST on Investment Management Fees. The rates specified are the actual expenses charged as at the end of the month. MINIMUM INVESTMENT/
MULTIPLES FOR NEW INVESTORS:
Rs 5000/1 MINIMUM INVESTMENT FOR SIP
Rs 500/1 ADDITIONAL INVESTMENT/
MULTIPLES FOR EXISTING INVESTORS:
Rs1000/1 LOAD STRUCTURE:
Different plans have a different expense
structure
Flexi cap Fund- An open-ended dynamic equity scheme investing across large, mid and small cap stocks
SCHEME CATEGORY
Flexi Cap Fund
SCHEME CHARACTERISTICS
Min 65% Equity across Large, Mid & Small Caps
INVESTMENT OBJECTIVE
The investment objective of this scheme is to provide growth of capital plus regular dividend through a diversified portfolio of equities, fixed income securities and money market instruments.
DATE OF ALLOTMENT:
September 29, 1994
FUND MANAGER(S):
R. Janakiraman, Rajasa Kakulavarapu (w.e.f December 1, 2023) &
Sandeep Manam (dedicated for making investments for Foreign Securities)
BENCHMARK:
Nifty 500
| TURNOVER: | |
| Portfolio Turnover | 24.67% |
| VOLATILITY MEASURES (3 YEARS): | |
| Standard Deviation | 3.45% |
| Beta | 0.90 |
| Sharpe Ratio* | 1.17 |
| * Annualised. Risk-free rate assumed to be 5.17% (FBIL OVERNIGHT MIBOR) | |
# The above ratio includes the GST on Investment Management Fees. The rates specified are the actual expenses charged as at the end of the month. MINIMUM INVESTMENT/
MULTIPLES FOR NEW INVESTORS:
Rs 5000/1 MINIMUM INVESTMENT FOR SIP
Rs 500/1 ADDITIONAL INVESTMENT/
MULTIPLES FOR EXISTING INVESTORS:
Rs1000/1 LOAD STRUCTURE:
| Entry Load | : | Nil |
| Exit Load (for each purchase of Units) | : | In respect of each purchase of Units - 1% if the Units are redeemed/switched-out within one year of allotment |
NAV AS OF FEBRUARY 27, 2026
| Growth Plan | Rs1627.1068 |
| IDCW Plan | Rs 62.9574 |
| Direct - Growth Plan | Rs1820.2458 |
| Direct - IDCW Plan | Rs70.3834 |
| As per the addendum dated March 31, 2021, the Dividend Plan has been renamed to Income Distribution cum capital withdrawal (IDCW) Plan with effect from April 1, 2021 | |
| FUND SIZE (AUM) | |
| Month End | Rs19597.86 crores |
| Monthly Average | Rs19828.09 crores |
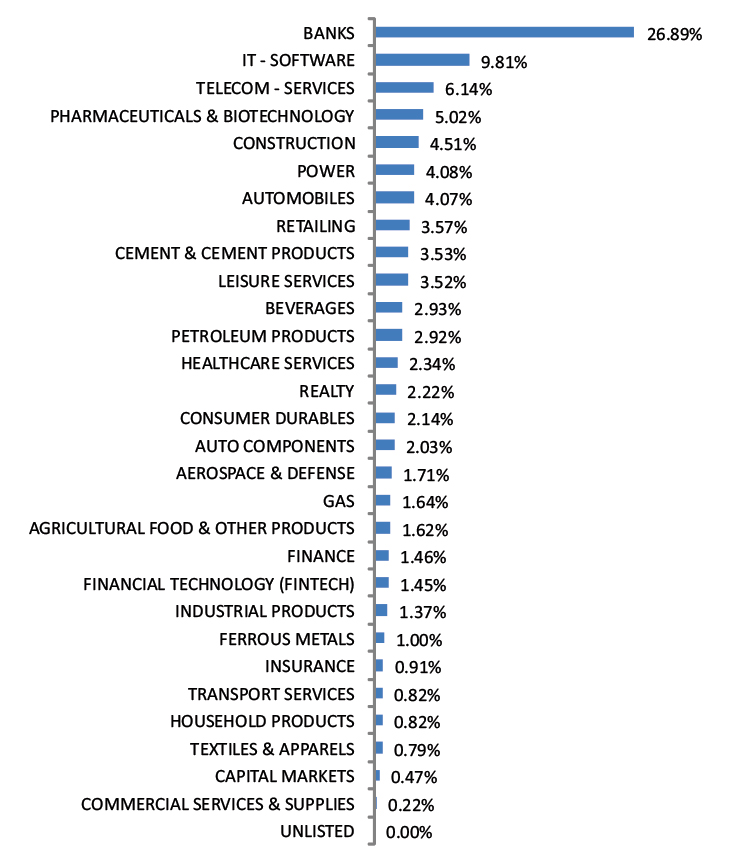
| Company Name | No. of shares | Market Value Rs Lakhs | % of assets | |
| Aerospace & Defense | ||||
| Bharat Electronics Ltd | 93,65,082 | 41,646.52 | 2.13 | |
| Hindustan Aeronautics Ltd | 4,92,329 | 19,265.82 | 0.98 | |
| Agricultural Food & Other Products | ||||
| Marico Ltd | 48,00,948 | 37,862.68 | 1.93 | |
| Agricultural, Commercial & Construction Vehicles | ||||
| Ashok Leyland Ltd | 1,43,62,908 | 30,320.10 | 1.55 | |
| Auto Components | ||||
| Tube Investments of India Ltd | 10,23,601 | 28,183.83 | 1.44 | |
| Amara Raja Energy And Mobility Ltd | 11,24,677 | 9,502.96 | 0.48 | |
| Automobiles | ||||
| Mahindra & Mahindra Ltd* | 16,12,271 | 54,775.29 | 2.79 | |
| Hyundai Motor India Ltd | 5,90,136 | 12,778.80 | 0.65 | |
| Banks | ||||
| HDFC Bank Ltd* | 1,86,69,284 | 1,65,736.57 | 8.46 | |
| ICICI Bank Ltd* | 88,91,035 | 1,22,598.48 | 6.26 | |
| Axis Bank Ltd* | 79,68,423 | 1,10,275.01 | 5.63 | |
| State Bank of India* | 65,06,362 | 78,186.95 | 3.99 | |
| Kotak Mahindra Bank Ltd* | 1,48,62,470 | 61,708.98 | 3.15 | |
| Beverages | ||||
| United Spirits Ltd | 23,70,003 | 32,725.00 | 1.67 | |
| Cement & Cement Products | ||||
| Grasim Industries Ltd | 16,49,761 | 46,190.01 | 2.36 | |
| Ultratech Cement Ltd | 2,32,916 | 29,526.76 | 1.51 | |
| Commercial Services & Supplies | ||||
| Teamlease Services Ltd | 2,01,314 | 2,454.82 | 0.13 | |
| Construction | ||||
| Larsen & Toubro Ltd* | 21,31,779 | 91,203.90 | 4.65 | |
| Consumer Durables | ||||
| Kalyan Jewellers India Ltd | 41,03,784 | 16,829.62 | 0.86 | |
| PG Electroplast Ltd | 26,09,393 | 16,384.38 | 0.84 | |
| Ferrous Metals | ||||
| Tata Steel Ltd | 1,91,80,899 | 40,726.80 | 2.08 | |
| Fertilizers & Agrochemicals | ||||
| PI Industries Ltd | 6,27,740 | 19,568.54 | 1.00 | |
| Finance | ||||
| Cholamandalam Investment and Finance Co Ltd | 17,86,393 | 30,918.89 | 1.58 | |
| Tata Capital Ltd | 40,38,474 | 13,472.35 | 0.69 | |
| Financial Technology (Fintech) | ||||
| PB Fintech Ltd | 17,18,320 | 25,458.63 | 1.30 | |
| Food Products | ||||
| Britannia Industries Ltd | 5,14,691 | 30,894.33 | 1.58 | |
| Gas | ||||
| GAIL (India) Ltd | 3,061 | 5.19 | 0.00 | |
| Healthcare Services | ||||
| Apollo Hospitals Enterprise Ltd | 5,91,846 | 46,291.23 | 2.36 | |
| Syngene International Ltd | 10,04,390 | 4,240.53 | 0.22 | |
| Household Products | ||||
| Jyothy Labs Ltd | 39,34,184 | 9,971.58 | 0.51 | |
| Industrial Manufacturing | ||||
| Syrma SGS Technology Ltd | 7,27,666 | 5,983.23 | 0.31 | |
| Industrial Products | ||||
| Kirloskar Oil Engines Ltd | 25,96,337 | 36,172.17 | 1.85 | |
| Insurance | ||||
| HDFC Life Insurance Co Ltd | 25,16,094 | 17,997.62 | 0.92 | |
| IT - Software | ||||
| Infosys Ltd* | 45,15,580 | 58,707.06 | 3.00 | |
| HCL Technologies Ltd | 35,55,589 | 49,390.69 | 2.52 | |
| Intellect Design Arena Ltd | 13,70,355 | 9,559.60 | 0.49 | |
| Leisure Services | ||||
| Lemon Tree Hotels Ltd | 76,82,853 | 8,733.10 | 0.45 | |
| Jubilant Foodworks Ltd | 15,76,915 | 8,198.38 | 0.42 | |
| Devyani International Ltd | 29,43,940 | 3,751.76 | 0.19 | |
| Oil | ||||
| Oil & Natural Gas Corporation Ltd | 1,34,65,272 | 37,662.37 | 1.92 | |
| Petroleum Products | ||||
| Reliance Industries Ltd* | 44,93,052 | 62,628.65 | 3.20 | |
| Pharmaceuticals & Biotechnology | ||||
| Cipla Ltd | 19,00,000 | 25,615.80 | 1.31 | |
| Eris Lifesciences Ltd | 12,52,402 | 17,011.38 | 0.87 | |
| Sun Pharmaceutical Industries Ltd | 3,10,835 | 5,399.20 | 0.28 | |
| Power | ||||
| NTPC Ltd | 98,74,772 | 37,711.75 | 1.92 | |
| Tata Power Co Ltd | 92,45,469 | 34,906.27 | 1.78 | |
| CESC Ltd | 80,38,760 | 12,713.30 | 0.65 | |
| Realty | ||||
| Godrej Properties Ltd | 8,24,053 | 14,264.36 | 0.73 | |
| Prestige Estates Projects Ltd | 9,75,284 | 13,585.71 | 0.69 | |
| Retailing | ||||
| Eternal Ltd | 1,87,83,160 | 46,262.92 | 2.36 | |
| Trent Ltd | 6,04,774 | 23,583.16 | 1.20 | |
| MedPlus Health Services Ltd | 13,53,229 | 11,469.97 | 0.59 | |
| Telecom - Services | ||||
| Bharti Airtel Ltd* | 36,30,906 | 68,235.62 | 3.48 | |
| Transport Services | ||||
| Interglobe Aviation Ltd | 7,21,111 | 34,809.47 | 1.78 | |
| Unlisted | ||||
| Numero Uno International Ltd | 73,500 | 0.01 | 0.00 | |
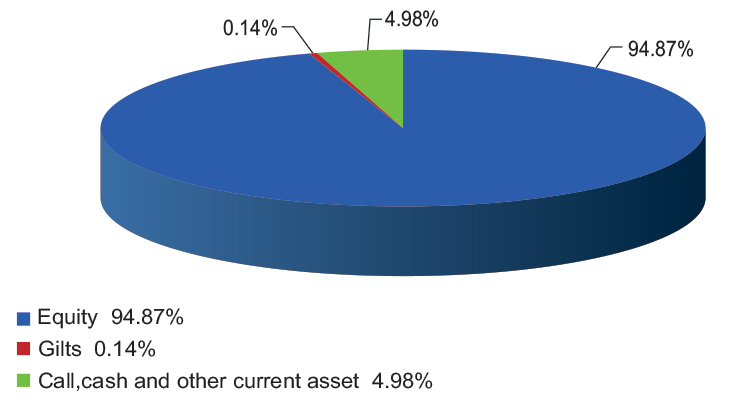
| Total Equity Holdings | 18,74,058.08 | 95.63 | ||
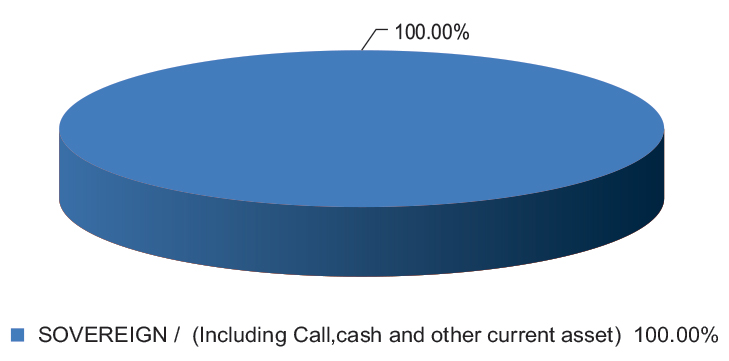
| Company Name | Company Ratings | Market Value (including accrued interest, if any) (Rs. in Lakhs) | % of Assets | |
| 91 DTB (17-APR-2026) | SOVEREIGN | 4,965.88 | 0.25 | |
| Total Gilts | 4,965.88 | 0.25 | ||
| Total Debt Holdings | 4,965.88 | 0.25 | ||
| Total Holdings | 18,79,023.96 | 95.88 | ||
| Call,cash and other current asset | 80,761.82 | 4.12 | ||
| Total Asset | 19,59,785.79 | 100.00 | ||
| * Top 10 holdings | ||||
@ Reverse Repo : 4.24%, Others (Cash/ Subscription receivable/ Redemption payable/ Receivables on sale/Payable on Purchase/ Other Receivable / Other Payable) : -0.12%
Please click here for Product Label & Benchmark Risk-o-meter.
The scheme has undergone a fundamental attribute change with effect from January 29, 2021. Please read the addendum on our website for further details.