
Franklin India Opportunities Fund
As on May 29, 2026
|
Franklin India Opportunities Fund As on May 29, 2026 |
|


|
TYPE OF SCHEME
An open ended equity scheme following special situations theme
SCHEME CATEGORY
Thematic - Special Situations
SCHEME CHARACTERISTICS
Min 80% Equity in Special Situations theme
INVESTMENT OBJECTIVE
To generate capital appreciation by investing in opportunities presented by special situations such as corporate restructuring, Government policy and/or regulatory changes, companies going through temporary unique challenges and other similar instances.
DATE OF ALLOTMENT:
February 21, 2000
FUND MANAGER(S):
Kiran Sebastian & R Janakiraman
Sandeep Manam (dedicated for making investments for Foreign Securities)
BENCHMARK:
Nifty 500
BASE EXPENSE RATIO#: 1.52%
BASE EXPENSE RATIO# (DIRECT) : 0.48%
#Base Expense Ratio (BER) is the actual expense ratio charged as per the AUM slabs and within the BER limits prescribed in Regulation 66 of SEBI MF regulations. BER excludes brokerage and transaction costs incurred towards execution of trades and the applicable statutory levies as on that date. Brokerage and transaction costs incurred towards execution of trades and statutory levies are charged, at actuals, and is over and above the BER.
For Total Expense Ratio (TER) and break up of TER i.e., BER, brokerage and transaction costs and statutory levies, please refer to daily TER disclosures on our website www.franklintempletonindia.com. For detailed understanding of TER, please refer to the TER note on our website - http://bit.ly/4uHkUph MINIMUM INVESTMENT/
MULTIPLES FOR NEW INVESTORS:
Rs 5000/1 MINIMUM INVESTMENT FOR SIP
Rs 500/1 ADDITIONAL INVESTMENT/
MULTIPLES FOR EXISTING INVESTORS:
Rs1000/1 LOAD STRUCTURE:
Different plans have a different expense structure
An open ended equity scheme following special situations theme
SCHEME CATEGORY
Thematic - Special Situations
SCHEME CHARACTERISTICS
Min 80% Equity in Special Situations theme
INVESTMENT OBJECTIVE
To generate capital appreciation by investing in opportunities presented by special situations such as corporate restructuring, Government policy and/or regulatory changes, companies going through temporary unique challenges and other similar instances.
DATE OF ALLOTMENT:
February 21, 2000
FUND MANAGER(S):
Kiran Sebastian & R Janakiraman
Sandeep Manam (dedicated for making investments for Foreign Securities)
BENCHMARK:
Nifty 500
| TURNOVER: | |
| Portfolio Turnover | 67.92% |
| VOLATILITY MEASURES (3 YEARS): | |
| Standard Deviation | 5.12% |
| Beta | 1.03 |
| Sharpe Ratio* | 1.03 |
| * Annualised. Risk-free rate assumed to be 5.52% (FBIL OVERNIGHT MIBOR) | |
#Base Expense Ratio (BER) is the actual expense ratio charged as per the AUM slabs and within the BER limits prescribed in Regulation 66 of SEBI MF regulations. BER excludes brokerage and transaction costs incurred towards execution of trades and the applicable statutory levies as on that date. Brokerage and transaction costs incurred towards execution of trades and statutory levies are charged, at actuals, and is over and above the BER.
For Total Expense Ratio (TER) and break up of TER i.e., BER, brokerage and transaction costs and statutory levies, please refer to daily TER disclosures on our website www.franklintempletonindia.com. For detailed understanding of TER, please refer to the TER note on our website - http://bit.ly/4uHkUph MINIMUM INVESTMENT/
MULTIPLES FOR NEW INVESTORS:
Rs 5000/1 MINIMUM INVESTMENT FOR SIP
Rs 500/1 ADDITIONAL INVESTMENT/
MULTIPLES FOR EXISTING INVESTORS:
Rs1000/1 LOAD STRUCTURE:
| Entry Load | : | Nil |
| Exit Load (for each purchase of Units) | : | In respect of each purchase of Units - 1% if the Units are redeemed/switched-out within one year of allotment |
NAV AS OF MAY 29, 2026
| Growth Plan | Rs249.2107 |
| IDCW Plan | Rs35.7470 |
| Direct - Growth Plan | Rs277.8184 |
| Direct - IDCW Plan | Rs40.5153 |
| As per the addendum dated March 31, 2021, the Dividend Plan has been renamed to Income Distribution cum capital withdrawal (IDCW) Plan with effect from April 1, 2021 | |
| FUND SIZE (AUM) | |
| Month End | Rs8723.81 Crores |
| Monthly Average | Rs8634.31 Crores |
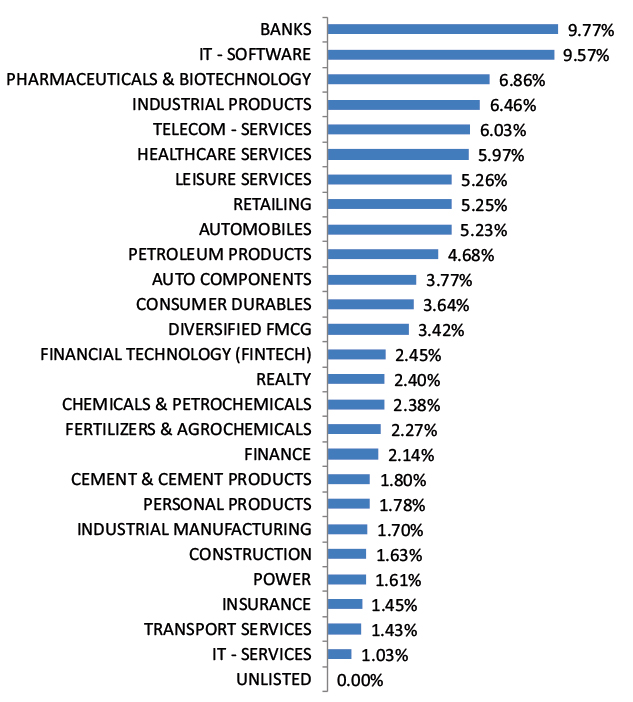
| Company Name | No. of shares | Market Value Rs Lakhs | % of assets |
| Aerospace & Defense | |||
| Hindustan Aeronautics Ltd* | 12,90,170 | 55,526.34 | 6.36 |
| Auto Components | |||
| Pricol Ltd | 15,63,667 | 8,789.37 | 1.01 |
| Automobiles | |||
| TVS Motor Co Ltd | 7,41,718 | 24,889.83 | 2.85 |
| Tata Motors Passenger Vehicles Ltd | 45,33,673 | 17,858.14 | 2.05 |
| Banks | |||
| Axis Bank Ltd* | 26,10,658 | 33,588.73 | 3.85 |
| State Bank of India* | 29,69,724 | 28,640.02 | 3.28 |
| IDFC First Bank Ltd | 2,58,78,858 | 18,456.80 | 2.12 |
| Ujjivan Small Finance Bank Ltd | 2,70,24,464 | 14,698.61 | 1.68 |
| HDFC Bank Ltd | 10,51,186 | 7,826.61 | 0.90 |
| Cement & Cement Products | |||
| Ultratech Cement Ltd | 1,13,843 | 13,071.45 | 1.50 |
| Chemicals & Petrochemicals | |||
| Sudarshan Chemical Industries Ltd | 14,95,526 | 14,028.03 | 1.61 |
| Deepak Nitrite Ltd | 3,36,107 | 5,653.32 | 0.65 |
| Consumer Durables | |||
| Asian Paints Ltd* | 10,18,302 | 27,204.96 | 3.12 |
| Amber Enterprises India Ltd | 2,53,035 | 19,268.62 | 2.21 |
| PG Electroplast Ltd | 24,33,483 | 11,742.77 | 1.35 |
| Finance | |||
| Shriram Finance Ltd* | 37,03,959 | 35,082.05 | 4.02 |
| IIFL Finance Ltd | 13,17,828 | 6,152.94 | 0.71 |
| Financial Technology (Fintech) | |||
| PB Fintech Ltd | 10,86,314 | 18,494.50 | 2.12 |
| Healthcare Services | |||
| Aster DM Healthcare Ltd | 22,94,130 | 16,709.30 | 1.92 |
| Metropolis Healthcare Ltd | 25,20,884 | 13,999.73 | 1.60 |
| Industrial Manufacturing | |||
| Amphenol Corp (USA)* | 2,34,384 | 33,124.49 | 3.80 |
| Syrma SGS Technology Ltd | 20,29,351 | 22,090.50 | 2.53 |
| Industrial Products | |||
| APL Apollo Tubes Ltd* | 16,62,735 | 30,446.34 | 3.49 |
| AIA Engineering Ltd | 5,67,437 | 25,555.09 | 2.93 |
| Kirloskar Oil Engines Ltd | 12,88,353 | 24,839.45 | 2.85 |
| Finolex Cables Ltd | 19,62,941 | 22,304.90 | 2.56 |
| SKF India Industrial Ltd | 3,79,685 | 8,212.97 | 0.94 |
| Insurance | |||
| SBI Life Insurance Co Ltd | 4,03,034 | 7,375.93 | 0.85 |
| IT - Services | |||
| Affle 3i Ltd | 7,75,972 | 11,352.47 | 1.30 |
| IT - Software | |||
| Mphasis Ltd | 6,05,572 | 13,754.96 | 1.58 |
| Intellect Design Arena Ltd | 11,48,909 | 8,235.95 | 0.94 |
| Zensar Technologies Ltd | 10,72,111 | 5,297.84 | 0.61 |
| CE Info Systems Ltd | 6,36,067 | 5,214.16 | 0.60 |
| Leisure Services | |||
| Lemon Tree Hotels Ltd | 90,02,650 | 10,258.52 | 1.18 |
| Petroleum Products | |||
| Reliance Industries Ltd* | 30,70,606 | 40,568.85 | 4.65 |
| Pharmaceuticals & Biotechnology | |||
| Mankind Pharma Ltd* | 11,38,424 | 27,044.40 | 3.10 |
| Akums Drugs And Pharmaceuticals Ltd | 25,33,367 | 13,287.51 | 1.52 |
| Piramal Pharma Ltd | 61,54,389 | 10,634.17 | 1.22 |
| Eris Lifesciences Ltd | 7,17,992 | 10,044.71 | 1.15 |
| Biocon Ltd | 14,613 | 62.64 | 0.01 |
| Power | |||
| NTPC Ltd* | 74,82,056 | 28,948.07 | 3.32 |
| Retailing | |||
| Eternal Ltd | 84,29,102 | 21,121.64 | 2.42 |
| Telecom - Services | |||
| Tata Communications Ltd | 7,31,054 | 14,365.21 | 1.65 |
| Indus Towers Ltd | 23,14,234 | 10,230.07 | 1.17 |
| Transport Services | |||
| Interglobe Aviation Ltd | 2,36,227 | 10,405.80 | 1.19 |
| Unlisted | |||
| Chennai Interactive Business Services Pvt Ltd | 23,815 | 0.00 | 0.00 |
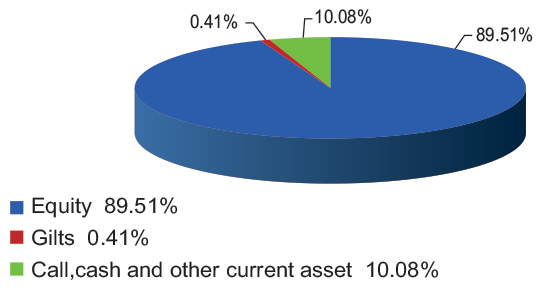
| Total Equity Holdings | 8,06,458.73 | 92.44 | |
| Company Name | Company Ratings | Market Value (including accrued interest, if any) (Rs. in Lakhs) | % of Assets |
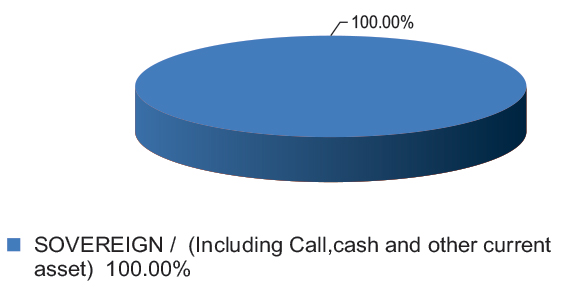
| 364 DTB (04-JUN-2026) | SOVEREIGN | 2,498.24 | 0.29 |
| Total Gilts | 2,498.24 | 0.29 | |
| Total Debt Holdings | 2,498.24 | 0.29 | |
| Total Holdings | 8,08,956.96 | 92.73 | |
| Call,cash and other current asset | 63,424.13 | 7.27 | |
| Total Asset | 8,72,381.09 | 100.00 | |
| * Top 10 holdings | |||
@ TREPs /Reverse Repo : 7.80%, Others (Cash/ Subscription receivable/ Redemption payable/ Receivables on sale/Payable on Purchase/ Other Receivable / Other Payable) : -0.53%
Please click here for Product Label & Benchmark Risk-o-meter.