
(Erstwhile Franklin India Pension Plan)
|
Franklin India Retirement Fund$$
(Erstwhile Franklin India Pension Plan) As on April 30, 2026 |
|


|
An open ended retirement solution oriented scheme having a lock-in of 5 years or till retirement age (whichever is earlier)
SCHEME CATEGORY
Retirement Fund
SCHEME CHARACTERISTICS
Lock-in of 5 years or till retirement age,whichever is earlier
INVESTMENT OBJECTIVE
The Fund seeks to provide investors regular income under the Dividend Plan and capital appreciation under the Growth Plan.
DATE OF ALLOTMENT:
March 31, 1997
FUND MANAGER(S):
Anuj Tagra (w.e.f. April 30, 2024) (Debt)
Pallab Roy (w.e.f. March 07, 2024)
Rajasa Kakulavarapu (Equity)
Ajay Argal (w.e.f. October 4, 2024)
BENCHMARK:
CRISIL Short Term Debt Hybrid 60+40 Index (The Benchmark has been changed from 40% Nifty 500+ 60% Crisil Composite Bond Index to CRISIL Short Term Debt Hybrid 60+40 Index w.e.f 12th August, 2024.)
| MATURITY & YIELD$ | |
| RESIDUAL MATURITY / AVERAGE MATURITY | 3.79 years |
| ANNUALISED PORTFOLIO YTM# | 7.55% |
| MODIFIED DURATION | 2.38 years |
| MACAULAY DURATION | 2.54 years |
| #Yields of all securities are in annualised terms $ Calculated based on debt holdings in the portfolio | |
#Base Expense Ratio (BER) is the actual expense ratio charged as per the AUM slabs and within the BER limits prescribed in Regulation 66 of SEBI MF regulations. BER excludes brokerage and transaction costs incurred towards execution of trades and the applicable statutory levies as on that date. Brokerage and transaction costs incurred towards execution of trades and statutory levies are charged, at actuals, and is over and above the BER.
For Total Expense Ratio (TER) and break up of TER i.e., BER, brokerage and transaction costs and statutory levies, please refer to daily TER disclosures on our website www.franklintempletonindia.com. For detailed understanding of TER, please refer to the TER note on our website. MINIMUM INVESTMENT/
MULTIPLES FOR NEW INVESTORS:
Rs 500/1 MINIMUM INVESTMENT FOR SIP
₹ 500/1
ADDITIONAL INVESTMENT/
MULTIPLES FOR EXISTING INVESTORS:
Rs500/1 LOAD STRUCTURE:
| Entry Load | : | Nil |
| Exit Load (for each purchase of Units) | : | 3%, if redeemed before the
age of 58 years (subject to
lock-in period) and target
amount
Nil, if redeemed after the
age of 58 years
|
| Different plans have a different expense structure
Retirement age : 60 years | ||
| TAX BENEFITS | ||
| Investments will qualify for tax benefit under the Section 80C as per the income tax act | ||
| LOCK-IN PERIOD & MINIMUM
TARGET INVESTMENT | ||
| For investment (including registered SIPs and incoming
STPs) made on or before June 1, 2018: Three (3) full
financial years For investments (including SIPs & STPs
registered) made on or after June 4, 2018: 5 years or till
retirement age (whichever is earlier) Minimum target investment Rs 10,000 before the age of 60 years. | ||
| Growth Plan | Rs 215.1227 |
| IDCW Plan | Rs 16.3336 |
| Direct - Growth Plan | Rs 237.1803 |
| Direct - IDCW Plan | Rs 18.0424 |
| As per the addendum dated March 31, 2021, the Dividend Plan has been renamed to Income Distribution cum capital withdrawal (IDCW) Plan with effect from April 1, 2021 | |
| FUND SIZE (AUM) | |
| Month End | Rs 496.83 crores |
| Monthly Average | Rs 496.51 crores |
| Company Name | No. of shares | Market Value Rs Lakhs | % of assets |
| Aerospace & Defense | |||
| Bharat Electronics Ltd | 70,000 | 301.91 | 0.61 |
| Hindustan Aeronautics Ltd | 5,000 | 216.94 | 0.44 |
| Agricultural Food & Other Products | |||
| Marico Ltd | 42,000 | 325.50 | 0.66 |
| Agricultural, Commercial & Construction Vehicles | |||
| Ashok Leyland Ltd | 1,00,000 | 162.09 | 0.33 |
| Auto Components | |||
| Amara Raja Energy And Mobility Ltd | 17,690 | 154.71 | 0.31 |
| ZF Commercial Vehicle Control Systems India Ltd | 400 | 58.80 | 0.12 |
| Motherson Sumi Wiring India Ltd | 1,14,942 | 46.60 | 0.09 |
| Automobiles | |||
| Mahindra & Mahindra Ltd | 14,000 | 433.65 | 0.87 |
| Maruti Suzuki India Ltd | 1,500 | 199.71 | 0.40 |
| Banks | |||
| HDFC Bank Ltd* | 1,80,000 | 1,389.06 | 2.80 |
| ICICI Bank Ltd | 82,000 | 1,035.99 | 2.09 |
| State Bank of India | 80,000 | 854.76 | 1.72 |
| Axis Bank Ltd | 67,000 | 849.76 | 1.71 |
| Capital Markets | |||
| Angel One Ltd | 15,000 | 46.31 | 0.09 |
| Cement & Cement Products | |||
| Ultratech Cement Ltd | 4,100 | 475.03 | 0.96 |
| Construction | |||
| Larsen & Toubro Ltd | 20,500 | 822.87 | 1.66 |
| Consumer Durables | |||
| Amber Enterprises India Ltd | 3,500 | 280.84 | 0.57 |
| Diversified FMCG | |||
| Hindustan Unilever Ltd | 8,500 | 191.33 | 0.39 |
| Ferrous Metals | |||
| Tata Steel Ltd | 1,70,000 | 359.31 | 0.72 |
| Finance | |||
| Cholamandalam Investment and Finance Co Ltd | 12,000 | 187.55 | 0.38 |
| Tata Capital Ltd | 56,000 | 186.56 | 0.38 |
| PNB Housing Finance Ltd | 15,000 | 156.85 | 0.32 |
| Financial Technology (Fintech) | |||
| PB Fintech Ltd | 21,000 | 349.90 | 0.70 |
| Food Products | |||
| Britannia Industries Ltd | 6,700 | 383.64 | 0.77 |
| Healthcare Services | |||
| Apollo Hospitals Enterprise Ltd | 6,000 | 458.19 | 0.92 |
| Metropolis Healthcare Ltd | 54,000 | 257.31 | 0.52 |
| Industrial Products | |||
| Kirloskar Oil Engines Ltd | 23,000 | 390.59 | 0.79 |
| Insurance | |||
| ICICI Lombard General Insurance Co Ltd | 14,000 | 246.85 | 0.50 |
| HDFC Life Insurance Co Ltd | 30,000 | 176.07 | 0.35 |
| Canara HSBC Life Insurance Co Ltd | 96,570 | 136.45 | 0.27 |
| IT - Software | |||
| Infosys Ltd | 56,604 | 668.95 | 1.35 |
| HCL Technologies Ltd | 41,000 | 491.63 | 0.99 |
| Leisure Services | |||
| Lemon Tree Hotels Ltd | 1,20,000 | 141.11 | 0.28 |
| Petroleum Products | |||
| Reliance Industries Ltd | 70,000 | 1,001.56 | 2.02 |
| Pharmaceuticals & Biotechnology | |||
| Eris Lifesciences Ltd | 15,441 | 204.27 | 0.41 |
| Power | |||
| NTPC Ltd | 1,40,000 | 558.81 | 1.12 |
| CESC Ltd | 2,00,000 | 375.06 | 0.75 |
| Realty | |||
| Phoenix Mills Ltd | 17,000 | 300.05 | 0.60 |
| Retailing | |||
| Eternal Ltd | 2,00,000 | 494.06 | 0.99 |
| V-Mart Retail Ltd | 15,000 | 92.47 | 0.19 |
| Telecom - Services | |||
| Bharti Airtel Ltd | 45,000 | 849.06 | 1.71 |
| Transport Services | |||
| Interglobe Aviation Ltd | 5,000 | 214.77 | 0.43 |
| Total Equity Holdings | 16,526.90 | 33.26 | |
| Company Name | Company Ratings | Market Value (including accrued interest, if any) (Rs. in Lakhs) | % of Assets |
| Jubilant Bevco Ltd* | CRISIL AA | 2,904.80 | 5.85 |
| LIC Housing Finance Ltd* | CARE AAA | 2,677.19 | 5.39 |
| Bajaj Housing Finance Ltd* | CRISIL AAA | 2,510.49 | 5.05 |
| Poonawalla Fincorp Ltd* | CRISIL AAA | 2,490.47 | 5.01 |
| Jubilant Beverages Ltd* | CRISIL AA | 1,931.41 | 3.89 |
| Bharti Telecom Ltd | CRISIL AAA | 1,059.70 | 2.13 |
| Kotak Mahindra Investments Ltd | CRISIL AAA | 539.36 | 1.09 |
| Total Corporate Debt | 14,113.41 | 28.41 | |
| National Bank For Agriculture & Rural Development* | IND AAA | 4,688.77 | 9.44 |
| Small Industries Development Bank Of India* | CRISIL AAA | 2,524.66 | 5.08 |
| National Bank for Financing Infrastructure and Development* | CRISIL AAA | 2,451.15 | 4.93 |
| REC Ltd | CRISIL AAA | 1,070.25 | 2.15 |
| Total PSU/PFI Bonds | 10,734.83 | 21.61 | |
| Union Bank of India* | ICRA A1+ | 2,352.97 | 4.74 |
| Total Certificate Of Deposit | 2,352.97 | 4.74 | |
| 7.66% Maharashtra SDL (04-Mar-2047) | SOVEREIGN | 1,045.64 | 2.10 |
| 6.90% GOI 2065 (15-APR-2065) | SOVEREIGN | 1,000.59 | 2.01 |
| Total Gilts | 2,046.23 | 4.12 | |
| Total Debt Holdings | 29,247.44 | 58.87 | |
| Mutual Fund Units | |||
| Franklin India Long Duration Fund | 18,71,689 | 198.34 | 0.40 |
| Total Mutual Fund Units | 198.34 | 0.40 | |
| Total Holdings | 45,972.67 | 92.53 | |
| Call,cash and other current asset | 3,710.63 | 7.47 | |
| Total Asset | 49,683.31 | 100.00 | |
| * Top 10 holdings |
@ TREPs /Reverse Repo : 7.28%, Others (Cash/ Subscription receivable/ Redemption payable/ Receivables on sale/Payable on Purchase/ Other Receivable / Other Payable) : 0.19%
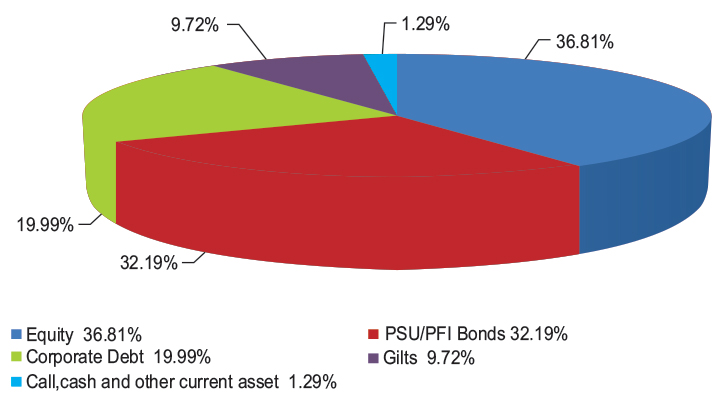
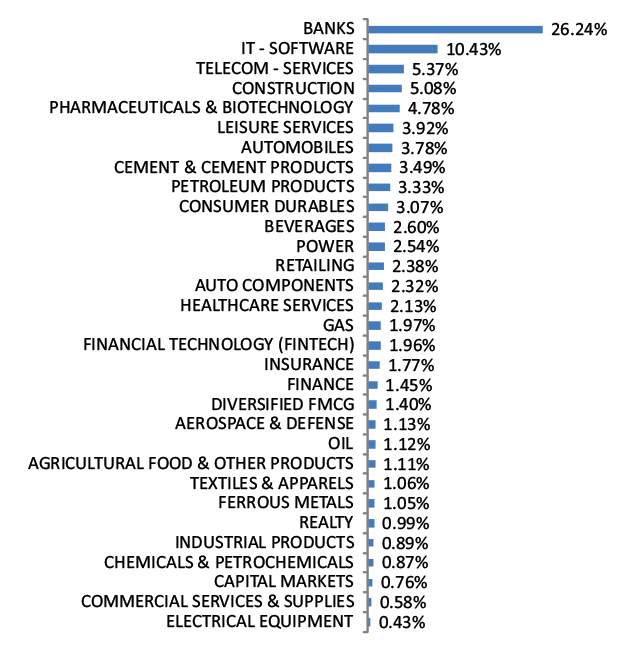 Note : Sector Allocation is provided as a percentage of Equity holding totaling to 100%
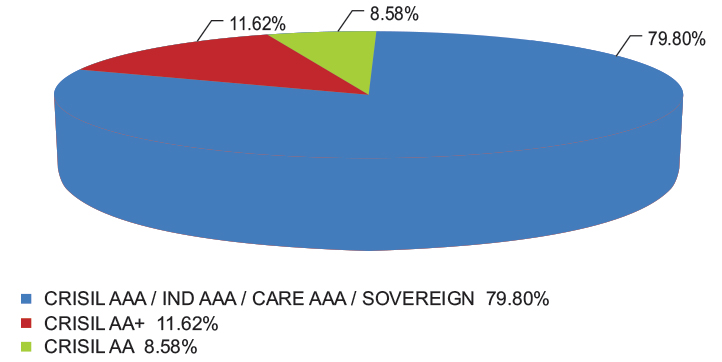
Composition by Rating is provided as a percentage of Debt Holding totaling to 100%
Note : Sector Allocation is provided as a percentage of Equity holding totaling to 100%
Composition by Rating is provided as a percentage of Debt Holding totaling to 100%
$$ - Franklin India Pension Plan has been renamed as Franklin India Retirement Fund effective July 11, 2025
This scheme has exposure to floating rate instruments. The duration of these instruments is linked to the interest rate reset period. The interest rate risk in a floating rate instrument or in a fixed rate instrument hedged with derivatives is likely to be lesser than that in an equivalent maturity fixed rate instrument. Under some market circumstances the volatility may be of an order greater than what may ordinarily be expected considering only its duration. Hence investors are recommended to consider the unadjusted portfolio maturity of the scheme as well and exercise adequate due diligence when deciding to make their investments.