
Franklin India Mid Cap Fund$$
(Erstwhile Franklin India Prima Fund)As on April 30, 2026
|
Franklin India Mid Cap Fund$$ (Erstwhile Franklin India Prima Fund) As on April 30, 2026 |
|


|
TYPE OF SCHEME
Mid-cap Fund- An open ended equity scheme predominantly investing in mid cap stocks
SCHEME CATEGORY
Mid Cap Fund
SCHEME CHARACTERISTICS
Min 65% Mid Caps
INVESTMENT OBJECTIVE
The investment objective of Prima Fund is to provide medium to longterm capital appreciation as a primary objective and income as a secondary objective.
DATE OF ALLOTMENT:
December 1, 1993
FUND MANAGER(S):
Akhil Kalluri & R Janakiraman
Sandeep Manam (dedicated for making investments for Foreign Securities)
BENCHMARK:
Nifty Midcap 150
BASE EXPENSE RATIO#: 1.48%
BASE EXPENSE RATIO# (DIRECT) : 0.85%
#Base Expense Ratio (BER) is the actual expense ratio charged as per the AUM slabs and within the BER limits prescribed in Regulation 66 of SEBI MF regulations. BER excludes brokerage and transaction costs incurred towards execution of trades and the applicable statutory levies as on that date. Brokerage and transaction costs incurred towards execution of trades and statutory levies are charged, at actuals, and is over and above the BER.
For Total Expense Ratio (TER) and break up of TER i.e., BER, brokerage and transaction costs and statutory levies, please refer to daily TER disclosures on our website www.franklintempletonindia.com. For detailed understanding of TER, please refer to the TER note on our website. MINIMUM INVESTMENT/
MULTIPLES FOR NEW INVESTORS:
Rs 5000/1 MINIMUM INVESTMENT FOR SIP
Rs 500/1 ADDITIONAL INVESTMENT/
MULTIPLES FOR EXISTING INVESTORS:
Rs1000/1 LOAD STRUCTURE:
Different plans have a different expense structure
Mid-cap Fund- An open ended equity scheme predominantly investing in mid cap stocks
SCHEME CATEGORY
Mid Cap Fund
SCHEME CHARACTERISTICS
Min 65% Mid Caps
INVESTMENT OBJECTIVE
The investment objective of Prima Fund is to provide medium to longterm capital appreciation as a primary objective and income as a secondary objective.
DATE OF ALLOTMENT:
December 1, 1993
FUND MANAGER(S):
Akhil Kalluri & R Janakiraman
Sandeep Manam (dedicated for making investments for Foreign Securities)
BENCHMARK:
Nifty Midcap 150
| TURNOVER: | |
| Portfolio Turnover | 38.45% |
| VOLATILITY MEASURES (3 YEARS): | |
| Standard Deviation | 5.04% |
| Beta | 0.90 |
| Sharpe Ratio* | 0.86 |
| * Annualised. Risk-free rate assumed to be 5.34% (FBIL OVERNIGHT MIBOR) | |
#Base Expense Ratio (BER) is the actual expense ratio charged as per the AUM slabs and within the BER limits prescribed in Regulation 66 of SEBI MF regulations. BER excludes brokerage and transaction costs incurred towards execution of trades and the applicable statutory levies as on that date. Brokerage and transaction costs incurred towards execution of trades and statutory levies are charged, at actuals, and is over and above the BER.
For Total Expense Ratio (TER) and break up of TER i.e., BER, brokerage and transaction costs and statutory levies, please refer to daily TER disclosures on our website www.franklintempletonindia.com. For detailed understanding of TER, please refer to the TER note on our website. MINIMUM INVESTMENT/
MULTIPLES FOR NEW INVESTORS:
Rs 5000/1 MINIMUM INVESTMENT FOR SIP
Rs 500/1 ADDITIONAL INVESTMENT/
MULTIPLES FOR EXISTING INVESTORS:
Rs1000/1 LOAD STRUCTURE:
| Entry Load | : | Nil |
| Exit Load (for each purchase of Units) | : | In respect of each purchase of Units - 1% if the Units are redeemed/switched-out within one year of allotment |
NAV AS OF APRIL 30, 2026
| Growth Plan | Rs2656.8382 |
| IDCW Plan | Rs90.2019 |
| Direct - Growth Plan | Rs3005.0994 |
| Direct - IDCW Plan | Rs109.1528 |
| As per the addendum dated March 31, 2021, the Dividend Plan has been renamed to Income Distribution cum capital withdrawal (IDCW) Plan with effect from April 1, 2021 | |
| FUND SIZE (AUM) | |
| Month End | Rs12102.39 crores |
| Monthly Average | Rs11840.54 crores |
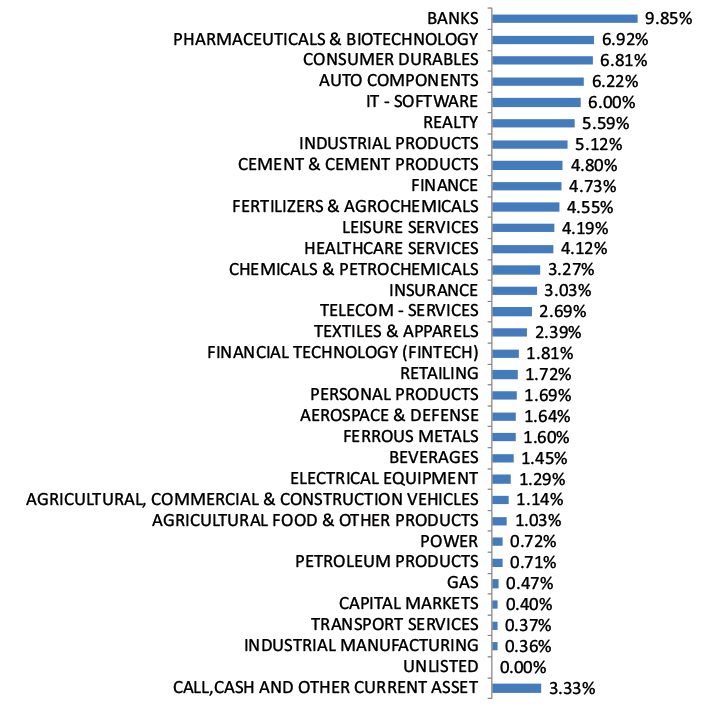
| Company Name | No. of shares | Market Value Rs Lakhs | % of assets | |
| Aerospace & Defense | ||||
| Hindustan Aeronautics Ltd | 2,81,300 | 12,205.04 | 1.01 | |
| Bharat Electronics Ltd | 26,17,750 | 11,290.36 | 0.93 | |
| Agricultural, Commercial & Construction Vehicles | ||||
| Ashok Leyland Ltd | 1,23,33,520 | 19,991.40 | 1.65 | |
| Escorts Kubota Ltd | 5,00,909 | 16,237.47 | 1.34 | |
| Auto Components | ||||
| Balkrishna Industries Ltd* | 11,75,000 | 25,389.40 | 2.10 | |
| Tube Investments of India Ltd* | 8,36,172 | 24,649.51 | 2.04 | |
| Motherson Sumi Wiring India Ltd | 2,62,04,805 | 10,623.43 | 0.88 | |
| Exide Industries Ltd | 28,03,019 | 10,106.29 | 0.84 | |
| Banks | ||||
| Federal Bank Ltd* | 1,03,24,683 | 29,626.68 | 2.45 | |
| IDFC First Bank Ltd* | 3,68,93,177 | 25,692.41 | 2.12 | |
| State Bank of India | 15,82,729 | 16,910.67 | 1.40 | |
| HDFC Bank Ltd | 20,96,350 | 16,177.53 | 1.34 | |
| Equitas Small Finance Bank Ltd | 2,35,80,355 | 15,763.47 | 1.30 | |
| IndusInd Bank Ltd | 10,50,000 | 9,618.53 | 0.79 | |
| City Union Bank Ltd | 23,48,208 | 6,342.27 | 0.52 | |
| Capital Markets | ||||
| Billionbrains Garage Ventures Ltd | 62,28,514 | 13,390.68 | 1.11 | |
| Angel One Ltd | 35,64,251 | 11,003.20 | 0.91 | |
| 360 One Wam Ltd | 6,28,909 | 6,507.01 | 0.54 | |
| Cement & Cement Products | ||||
| Shree Cement Ltd | 83,670 | 20,243.96 | 1.67 | |
| J.K. Cement Ltd | 3,37,051 | 17,819.89 | 1.47 | |
| The Ramco Cements Ltd | 10,71,904 | 10,023.37 | 0.83 | |
| Chemicals & Petrochemicals | ||||
| Deepak Nitrite Ltd | 11,00,123 | 19,108.04 | 1.58 | |
| SRF Ltd | 7,32,594 | 18,451.11 | 1.52 | |
| Consumer Durables | ||||
| Kalyan Jewellers India Ltd | 43,91,895 | 18,127.55 | 1.50 | |
| Crompton Greaves Consumer Electricals Ltd | 63,91,052 | 17,406.67 | 1.44 | |
| Havells India Ltd | 13,62,332 | 16,901.09 | 1.40 | |
| Dixon Technologies (India) Ltd | 1,35,340 | 15,112.74 | 1.25 | |
| Kajaria Ceramics Ltd | 4,95,000 | 5,878.87 | 0.49 | |
| Electrical Equipment | ||||
| Emmvee Photovoltaic Power Ltd | 57,51,488 | 15,091.90 | 1.25 | |
| Siemens Energy India ltd | 4,35,482 | 14,278.58 | 1.18 | |
| Suzlon Energy Ltd | 2,25,00,000 | 12,505.50 | 1.03 | |
| Thermax Ltd | 2,00,000 | 8,155.20 | 0.67 | |
| Ferrous Metals | ||||
| Tata Steel Ltd | 98,50,000 | 20,818.96 | 1.72 | |
| Fertilizers & Agrochemicals | ||||
| PI Industries Ltd | 3,74,936 | 11,453.54 | 0.95 | |
| Coromandel International Ltd | 5,77,620 | 11,446.70 | 0.95 | |
| Finance | ||||
| Mahindra & Mahindra Financial Services Ltd* | 74,13,356 | 23,033.30 | 1.90 | |
| PNB Housing Finance Ltd | 14,00,001 | 14,639.11 | 1.21 | |
| HDB Financial Services Ltd | 22,08,439 | 14,500.61 | 1.20 | |
| Poonawalla Fincorp Ltd | 33,71,544 | 14,066.08 | 1.16 | |
| L&T Finance Ltd | 21,00,000 | 5,874.33 | 0.49 | |
| Financial Technology (Fintech) | ||||
| PB Fintech Ltd | 10,50,578 | 17,504.73 | 1.45 | |
| Healthcare Services | ||||
| Max Healthcare Institute Ltd | 14,02,413 | 13,926.66 | 1.15 | |
| Aster DM Healthcare Ltd | 17,78,263 | 12,466.51 | 1.03 | |
| Industrial Products | ||||
| APL Apollo Tubes Ltd* | 11,99,891 | 22,857.92 | 1.89 | |
| Timken India Ltd | 3,87,745 | 13,295.00 | 1.10 | |
| Cummins India Ltd | 2,27,366 | 11,974.00 | 0.99 | |
| Astral Ltd | 7,75,000 | 11,855.18 | 0.98 | |
| Insurance | ||||
| ICICI Lombard General Insurance Co Ltd | 12,95,000 | 22,833.44 | 1.89 | |
| Max Financial Services Ltd | 10,57,487 | 16,768.57 | 1.39 | |
| IT - Software | ||||
| Mphasis Ltd* | 11,52,885 | 26,247.73 | 2.17 | |
| Coforge Ltd | 14,48,384 | 17,321.22 | 1.43 | |
| Hexaware Technologies Ltd | 24,97,849 | 11,181.62 | 0.92 | |
| Persistent Systems Ltd | 1,67,491 | 8,039.57 | 0.66 | |
| Leisure Services | ||||
| Jubilant Foodworks Ltd | 26,86,292 | 12,856.59 | 1.06 | |
| ITC Hotels Ltd | 59,93,530 | 9,623.81 | 0.80 | |
| Indian Hotels Co Ltd | 13,02,118 | 8,279.52 | 0.68 | |
| Personal Products | ||||
| Emami Ltd | 29,76,225 | 13,229.32 | 1.09 | |
| Procter & Gamble Hygiene and Health Care Ltd | 1,21,744 | 12,352.75 | 1.02 | |
| Petroleum Products | ||||
| Hindustan Petroleum Corporation Ltd | 30,93,002 | 11,584.84 | 0.96 | |
| Pharmaceuticals & Biotechnology | ||||
| Biocon Ltd* | 72,19,684 | 25,965.59 | 2.15 | |
| Mankind Pharma Ltd* | 10,29,108 | 23,120.97 | 1.91 | |
| IPCA Laboratories Ltd | 14,73,633 | 22,559.85 | 1.86 | |
| Abbott India Ltd | 52,304 | 13,303.52 | 1.10 | |
| Power | ||||
| Tata Power Co Ltd | 32,00,000 | 14,225.60 | 1.18 | |
| Realty | ||||
| Prestige Estates Projects Ltd* | 16,31,918 | 23,081.85 | 1.91 | |
| Phoenix Mills Ltd | 11,32,124 | 19,981.99 | 1.65 | |
| Oberoi Realty Ltd | 9,73,135 | 16,247.46 | 1.34 | |
| Godrej Properties Ltd | 7,25,956 | 13,322.74 | 1.10 | |
| Retailing | ||||
| Swiggy Ltd | 54,55,555 | 14,746.37 | 1.22 | |
| Trent Ltd | 2,93,937 | 12,182.51 | 1.01 | |
| Vishal Mega Mart Ltd | 77,41,030 | 9,466.51 | 0.78 | |
| Telecom - Services | ||||
| Tata Communications Ltd | 8,84,291 | 13,976.22 | 1.15 | |
| Bharti Hexacom Ltd | 7,87,855 | 11,954.91 | 0.99 | |
| Indus Towers Ltd | 26,05,137 | 10,679.76 | 0.88 | |
| Textiles & Apparels | ||||
| Page Industries Ltd | 48,500 | 17,840.73 | 1.47 | |
| K.P.R. Mill Ltd | 12,00,000 | 11,239.20 | 0.93 | |
| Transport Services | ||||
| Container Corporation Of India Ltd | 15,12,125 | 7,694.45 | 0.64 | |
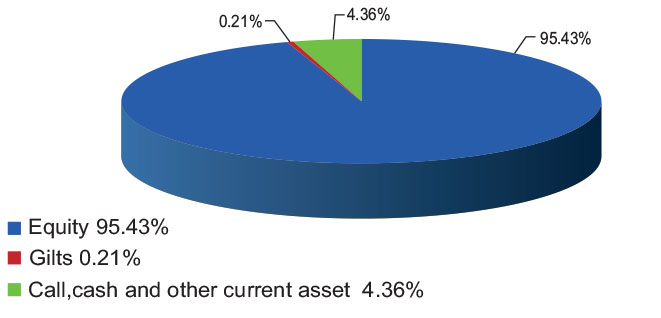
| Total Equity Holdings | 11,62,251.66 | 96.03 | ||
| Company Name | Company Ratings | Market Value (including accrued interest, if any) (Rs. in Lakhs) | % of Assets | |
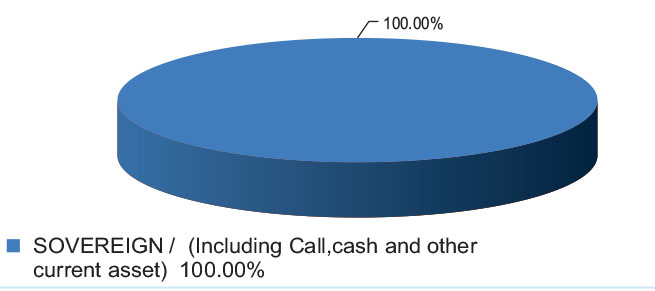
| 364 DTB (04-JUN-2026) | SOVEREIGN | 2,488.09 | 0.21 | |
| Total Gilts | 2,488.09 | 0.21 | ||
| Total Debt Holdings | 2,488.09 | 0.21 | ||
| Total Holdings | 11,64,739.75 | 96.24 | ||
| Call,cash and other current asset | 45,499.12 | 3.76 | ||
| Total Asset | 12,10,238.87 | 100.00 | ||
| * Top 10 holdings | ||||
@ TREPs /Reverse Repo : 3.59%, Others (Cash/ Subscription receivable/ Redemption payable/ Receivables on sale/Payable on Purchase/ Other Receivable / Other Payable) : 0.17%
Please click here for Product Label & Benchmark Risk-o-meter.