
Franklin India Small Cap Fund$$
(Erstwhile Franklin India Smaller Companies Fund)As on May 29, 2026
|
Franklin India Small Cap Fund$$ (Erstwhile Franklin India Smaller Companies Fund) As on May 29, 2026 |
|


|
TYPE OF SCHEME
Small-cap Fund- An open ended equity scheme predominantly investing in small cap stocks
SCHEME CATEGORY
Small Cap Fund
SCHEME CHARACTERISTICS
Min 65% Small Caps
INVESTMENT OBJECTIVE
The Fund seeks to provide long-term capital appreciation by investing predominantly in small cap companies
DATE OF ALLOTMENT:
January 13, 2006 (Launched as a closed end scheme, the scheme was converted into an open end scheme effective January 14, 2011).
FUND MANAGER(S):
Akhil Kalluri (effective September 8, 2022 )
R Janakiraman
Sandeep Manam
(dedicated for making investments for Foreign Securities)
BENCHMARK:
Nifty Smallcap 250
BASE EXPENSE RATIO#: 1.46%
BASE EXPENSE RATIO# (DIRECT) : 0.77%
#Base Expense Ratio (BER) is the actual expense ratio charged as per the AUM slabs and within the BER limits prescribed in Regulation 66 of SEBI MF regulations. BER excludes brokerage and transaction costs incurred towards execution of trades and the applicable statutory levies as on that date. Brokerage and transaction costs incurred towards execution of trades and statutory levies are charged, at actuals, and is over and above the BER.
For Total Expense Ratio (TER) and break up of TER i.e., BER, brokerage and transaction costs and statutory levies, please refer to daily TER disclosures on our website www.franklintempletonindia.com. For detailed understanding of TER, please refer to the TER note on our website - http://bit.ly/4uHkUph MINIMUM INVESTMENT/
MULTIPLES FOR NEW INVESTORS:
Rs 5000/1 MINIMUM INVESTMENT FOR SIP
Rs 500/1 ADDITIONAL INVESTMENT/
MULTIPLES FOR EXISTING INVESTORS:
Rs1000/1 LOAD STRUCTURE:
Different plans have a different expense
structure
Small-cap Fund- An open ended equity scheme predominantly investing in small cap stocks
SCHEME CATEGORY
Small Cap Fund
SCHEME CHARACTERISTICS
Min 65% Small Caps
INVESTMENT OBJECTIVE
The Fund seeks to provide long-term capital appreciation by investing predominantly in small cap companies
DATE OF ALLOTMENT:
January 13, 2006 (Launched as a closed end scheme, the scheme was converted into an open end scheme effective January 14, 2011).
FUND MANAGER(S):
Akhil Kalluri (effective September 8, 2022 )
R Janakiraman
Sandeep Manam
(dedicated for making investments for Foreign Securities)
BENCHMARK:
Nifty Smallcap 250
| TURNOVER: | |
| Portfolio Turnover | 33.50% |
| VOLATILITY MEASURES (3 YEARS): | |
| Standard Deviation | 5.88% |
| Beta | 0.86 |
| Sharpe Ratio* | 0.56 |
| * Annualised. Risk-free rate assumed to be 5.52% (FBIL OVERNIGHT MIBOR) | |
#Base Expense Ratio (BER) is the actual expense ratio charged as per the AUM slabs and within the BER limits prescribed in Regulation 66 of SEBI MF regulations. BER excludes brokerage and transaction costs incurred towards execution of trades and the applicable statutory levies as on that date. Brokerage and transaction costs incurred towards execution of trades and statutory levies are charged, at actuals, and is over and above the BER.
For Total Expense Ratio (TER) and break up of TER i.e., BER, brokerage and transaction costs and statutory levies, please refer to daily TER disclosures on our website www.franklintempletonindia.com. For detailed understanding of TER, please refer to the TER note on our website - http://bit.ly/4uHkUph MINIMUM INVESTMENT/
MULTIPLES FOR NEW INVESTORS:
Rs 5000/1 MINIMUM INVESTMENT FOR SIP
Rs 500/1 ADDITIONAL INVESTMENT/
MULTIPLES FOR EXISTING INVESTORS:
Rs1000/1 LOAD STRUCTURE:
| Entry Load | : | Nil |
| Exit Load (for each purchase of Units) | : | 1% if the Units are redeemed/switched-out within one year of allotment |
NAV AS OF MAY 29, 2026
| Growth Plan | Rs169.9774 |
| IDCW Plan | Rs42.4902 |
| Direct - Growth Plan | Rs193.7450 |
| Direct - IDCW Plan | Rs50.3535 |
| As per the addendum dated March 31, 2021, the Dividend Plan has been renamed to Income Distribution cum capital withdrawal (IDCW) Plan with effect from April 1, 2021 | |
| FUND SIZE (AUM) | |
| Month End | Rs13847.34 Crores |
| Monthly Average | Rs13894.43 Crores |
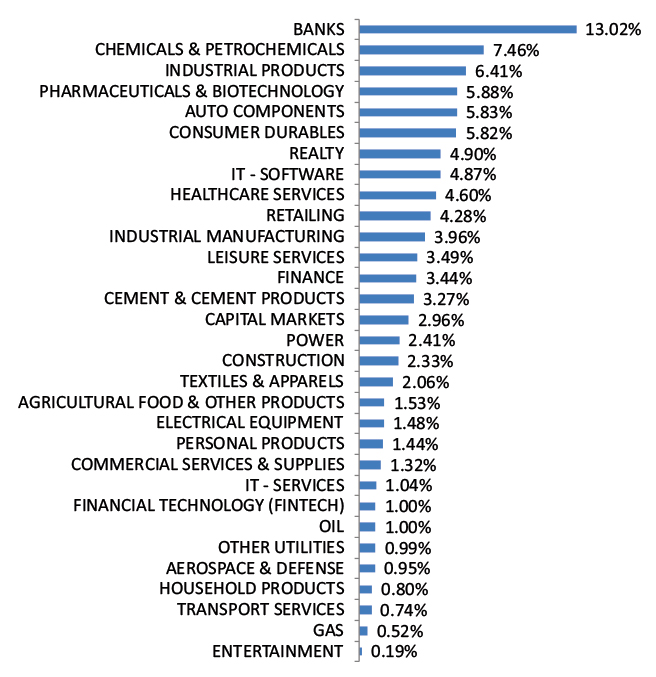
| Company Name | No. of shares | Market Value Rs Lakhs | % of assets | |
| Aerospace & Defense | ||||
| Hindustan Aeronautics Ltd | 5,35,000 | 23,025.33 | 1.66 | |
| Data Patterns India Ltd | 5,23,732 | 21,175.01 | 1.53 | |
| Agricultural Food & Other Products | ||||
| CCL Products (India) Ltd | 17,46,295 | 18,402.46 | 1.33 | |
| Agricultural, Commercial & Construction Vehicles | ||||
| Ajax Engineering Ltd | 10,63,013 | 6,271.78 | 0.45 | |
| Auto Components | ||||
| Amara Raja Energy And Mobility Ltd | 20,29,179 | 17,980.56 | 1.30 | |
| Sona Blw Precision Forgings Ltd | 27,18,807 | 16,515.39 | 1.19 | |
| Exide Industries Ltd | 39,95,660 | 15,443.23 | 1.12 | |
| ZF Commercial Vehicle Control Systems India Ltd | 93,876 | 13,775.36 | 0.99 | |
| Tenneco Clean Air India Ltd | 23,00,000 | 13,530.90 | 0.98 | |
| Rolex Rings Ltd | 74,64,845 | 10,488.85 | 0.76 | |
| Motherson Sumi Wiring India Ltd | 2,49,79,395 | 9,734.47 | 0.70 | |
| Pricol Ltd | 15,64,660 | 8,794.95 | 0.64 | |
| Banks | ||||
| Equitas Small Finance Bank Ltd* | 4,80,64,081 | 33,745.79 | 2.44 | |
| DCB Bank Ltd | 1,21,99,095 | 21,388.67 | 1.54 | |
| RBL Bank Ltd | 59,59,814 | 20,561.36 | 1.48 | |
| Axis Bank Ltd | 15,06,287 | 19,379.89 | 1.40 | |
| HDFC Bank Ltd | 23,72,250 | 17,662.59 | 1.28 | |
| Karur Vysya Bank Ltd | 51,79,481 | 14,955.75 | 1.08 | |
| Kotak Mahindra Bank Ltd | 38,00,000 | 14,599.60 | 1.05 | |
| Ujjivan Small Finance Bank Ltd | 2,60,02,065 | 14,142.52 | 1.02 | |
| City Union Bank Ltd | 47,48,860 | 12,130.96 | 0.88 | |
| Capital Markets | ||||
| Angel One Ltd* | 81,39,640 | 27,455.01 | 1.98 | |
| Cement & Cement Products | ||||
| The Ramco Cements Ltd | 13,06,390 | 11,381.27 | 0.82 | |
| The India Cements Ltd | 23,51,928 | 8,983.19 | 0.65 | |
| JK Lakshmi Cement Ltd | 14,89,763 | 8,794.82 | 0.64 | |
| Chemicals & Petrochemicals | ||||
| Deepak Nitrite Ltd | 13,87,967 | 23,345.60 | 1.69 | |
| Jubilant Ingrevia Ltd | 23,97,920 | 15,495.36 | 1.12 | |
| Atul Ltd | 2,15,000 | 14,739.33 | 1.06 | |
| Vishnu Chemicals Ltd | 16,59,420 | 9,609.70 | 0.69 | |
| Chemplast Sanmar Ltd | 42,14,678 | 9,120.98 | 0.66 | |
| GHCL Ltd | 15,97,501 | 7,255.05 | 0.52 | |
| Commercial Services & Supplies | ||||
| Shankara Buildpro Ltd | 11,30,373 | 13,166.58 | 0.95 | |
| Teamlease Services Ltd | 7,48,650 | 10,343.35 | 0.75 | |
| Consumer Durables | ||||
| Kajaria Ceramics Ltd* | 28,71,241 | 30,796.93 | 2.22 | |
| Crompton Greaves Consumer Electricals Ltd | 80,28,000 | 22,570.72 | 1.63 | |
| Kalyan Jewellers India Ltd | 49,63,469 | 17,622.80 | 1.27 | |
| PG Electroplast Ltd | 31,60,463 | 15,250.81 | 1.10 | |
| Whirlpool Of India Ltd | 15,75,000 | 12,954.38 | 0.94 | |
| Greenpanel Industries Ltd | 35,07,931 | 6,509.67 | 0.47 | |
| Electrical Equipment | ||||
| MTAR Technologies Ltd* | 3,91,982 | 30,886.22 | 2.23 | |
| Elecon Engineering Co Ltd | 33,79,635 | 17,236.14 | 1.24 | |
| Vikram Solar Ltd | 20,00,000 | 3,984.20 | 0.29 | |
| Ferrous Metals | ||||
| Tata Steel Ltd | 85,00,000 | 17,681.70 | 1.28 | |
| Finance | ||||
| PNB Housing Finance Ltd* | 27,21,134 | 28,041.29 | 2.03 | |
| IIFL Finance Ltd | 22,62,962 | 10,565.77 | 0.76 | |
| Financial Technology (Fintech) | ||||
| Pine Labs Ltd | 1,40,13,252 | 20,250.55 | 1.46 | |
| Food Products | ||||
| Mrs Bectors Food Specialities Ltd | 67,11,910 | 11,525.02 | 0.83 | |
| Gas | ||||
| Gujarat Gas Ltd | 24,04,003 | 9,643.66 | 0.70 | |
| Healthcare Services | ||||
| Aster DM Healthcare Ltd* | 34,31,339 | 24,992.16 | 1.80 | |
| Metropolis Healthcare Ltd | 43,73,434 | 24,287.87 | 1.75 | |
| Syngene International Ltd | 13,65,476 | 6,035.40 | 0.44 | |
| Industrial Manufacturing | ||||
| Syrma SGS Technology Ltd* | 30,28,902 | 32,971.11 | 2.38 | |
| Industrial Products | ||||
| Kirloskar Oil Engines Ltd* | 16,38,600 | 31,592.21 | 2.28 | |
| Finolex Industries Ltd | 1,03,09,386 | 19,198.14 | 1.39 | |
| Finolex Cables Ltd | 16,57,212 | 18,830.90 | 1.36 | |
| Kirloskar Pneumatic Co Ltd | 9,01,135 | 14,186.57 | 1.02 | |
| AIA Engineering Ltd | 2,52,000 | 11,349.07 | 0.82 | |
| Apollo Pipes Ltd | 20,23,000 | 10,294.04 | 0.74 | |
| Ratnamani Metals & Tubes Ltd | 2,50,083 | 6,383.87 | 0.46 | |
| IT - Software | ||||
| Zensar Technologies Ltd | 41,69,167 | 20,601.94 | 1.49 | |
| Hexaware Technologies Ltd | 38,09,372 | 19,351.61 | 1.40 | |
| Intellect Design Arena Ltd | 17,56,444 | 12,591.07 | 0.91 | |
| KPIT Technologies Ltd | 8,88,643 | 6,859.88 | 0.50 | |
| Leisure Services | ||||
| Lemon Tree Hotels Ltd | 1,44,70,368 | 16,488.98 | 1.19 | |
| Sapphire Foods India Ltd | 76,46,290 | 13,835.96 | 1.00 | |
| Brigade Hotel Ventures Ltd | 92,55,068 | 5,684.46 | 0.41 | |
| Other Utilities | ||||
| Ion Exchange (India) Ltd | 23,57,202 | 8,534.25 | 0.62 | |
| Personal Products | ||||
| Emami Ltd | 38,76,597 | 15,471.50 | 1.12 | |
| Pharmaceuticals & Biotechnology | ||||
| Eris Lifesciences Ltd* | 22,33,791 | 31,250.74 | 2.26 | |
| Akums Drugs And Pharmaceuticals Ltd | 22,30,054 | 11,696.63 | 0.84 | |
| Cipla Ltd | 6,93,000 | 9,708.93 | 0.70 | |
| Piramal Pharma Ltd | 33,34,415 | 5,761.54 | 0.42 | |
| J.B. Chemicals & Pharmaceuticals Ltd | 2,59,384 | 5,621.89 | 0.41 | |
| Indoco Remedies Ltd | 5,08,131 | 1,065.35 | 0.08 | |
| Power | ||||
| CESC Ltd | 1,34,01,420 | 24,402.65 | 1.76 | |
| Tata Power Co Ltd | 35,50,000 | 14,936.63 | 1.08 | |
| Realty | ||||
| Brigade Enterprises Ltd* | 38,68,691 | 25,237.41 | 1.82 | |
| Sobha Ltd | 15,13,099 | 21,455.74 | 1.55 | |
| Retailing | ||||
| MedPlus Health Services Ltd | 23,65,629 | 21,177.11 | 1.53 | |
| V-Mart Retail Ltd | 22,85,881 | 15,241.11 | 1.10 | |
| Electronics Mart India Ltd | 95,77,961 | 10,918.88 | 0.79 | |
| Vedant Fashions Ltd | 15,21,507 | 6,213.07 | 0.45 | |
| Aditya Vision Ltd | 9,23,838 | 4,941.15 | 0.36 | |
| Go Fashion India Ltd | 14,77,466 | 4,665.84 | 0.34 | |
| Textiles & Apparels | ||||
| K.P.R. Mill Ltd | 19,17,001 | 18,527.81 | 1.34 | |
| Transport Services | ||||
| Delhivery Ltd | 26,55,589 | 12,012.56 | 0.87 | |
| Gateway Distriparks Ltd | 1,37,93,660 | 7,724.45 | 0.56 | |
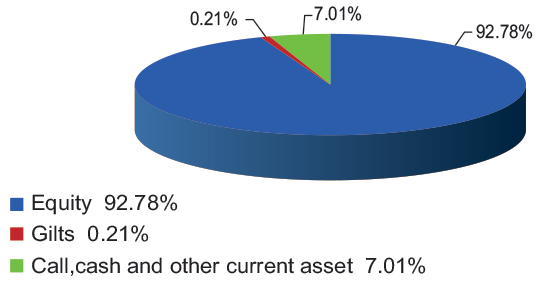
| Total Equity Holdings | 13,31,015.97 | 96.12 | ||
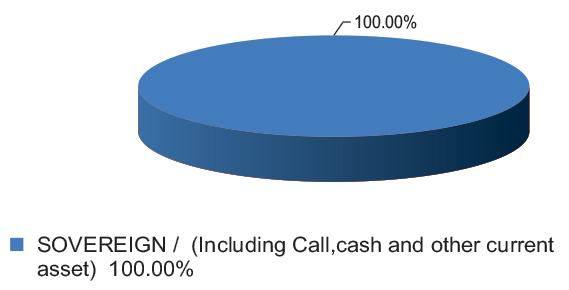
| Company Name | Company Ratings | Market Value (including accrued interest, if any) (Rs. in Lakhs) | % of Assets | |
| 364 DTB (04-JUN-2026) | SOVEREIGN | 2,498.24 | 0.18 | |
| Total Gilts | 2,498.24 | 0.18 | ||
| Total Debt Holdings | 2,498.24 | 0.18 | ||
| Total Holdings | 13,33,514.21 | 96.30 | ||
| Call,cash and other current asset | 51,219.56 | 3.70 | ||
| Total Asset | 13,84,733.77 | 100.00 | ||
| * Top 10 holdings | ||||
@ TREPs /Reverse Repo : 4.02%, Others (Cash/ Subscription receivable/ Redemption payable/ Receivables on sale/Payable on Purchase/ Other Receivable / Other Payable) : -0.32%
$$ - Franklin India Smaller Companies Fund has been renamed as Franklin India Small Cap Fund effective July 11, 2025
Please click here for Product Label & Benchmark Risk-o-meter.