
Market Review
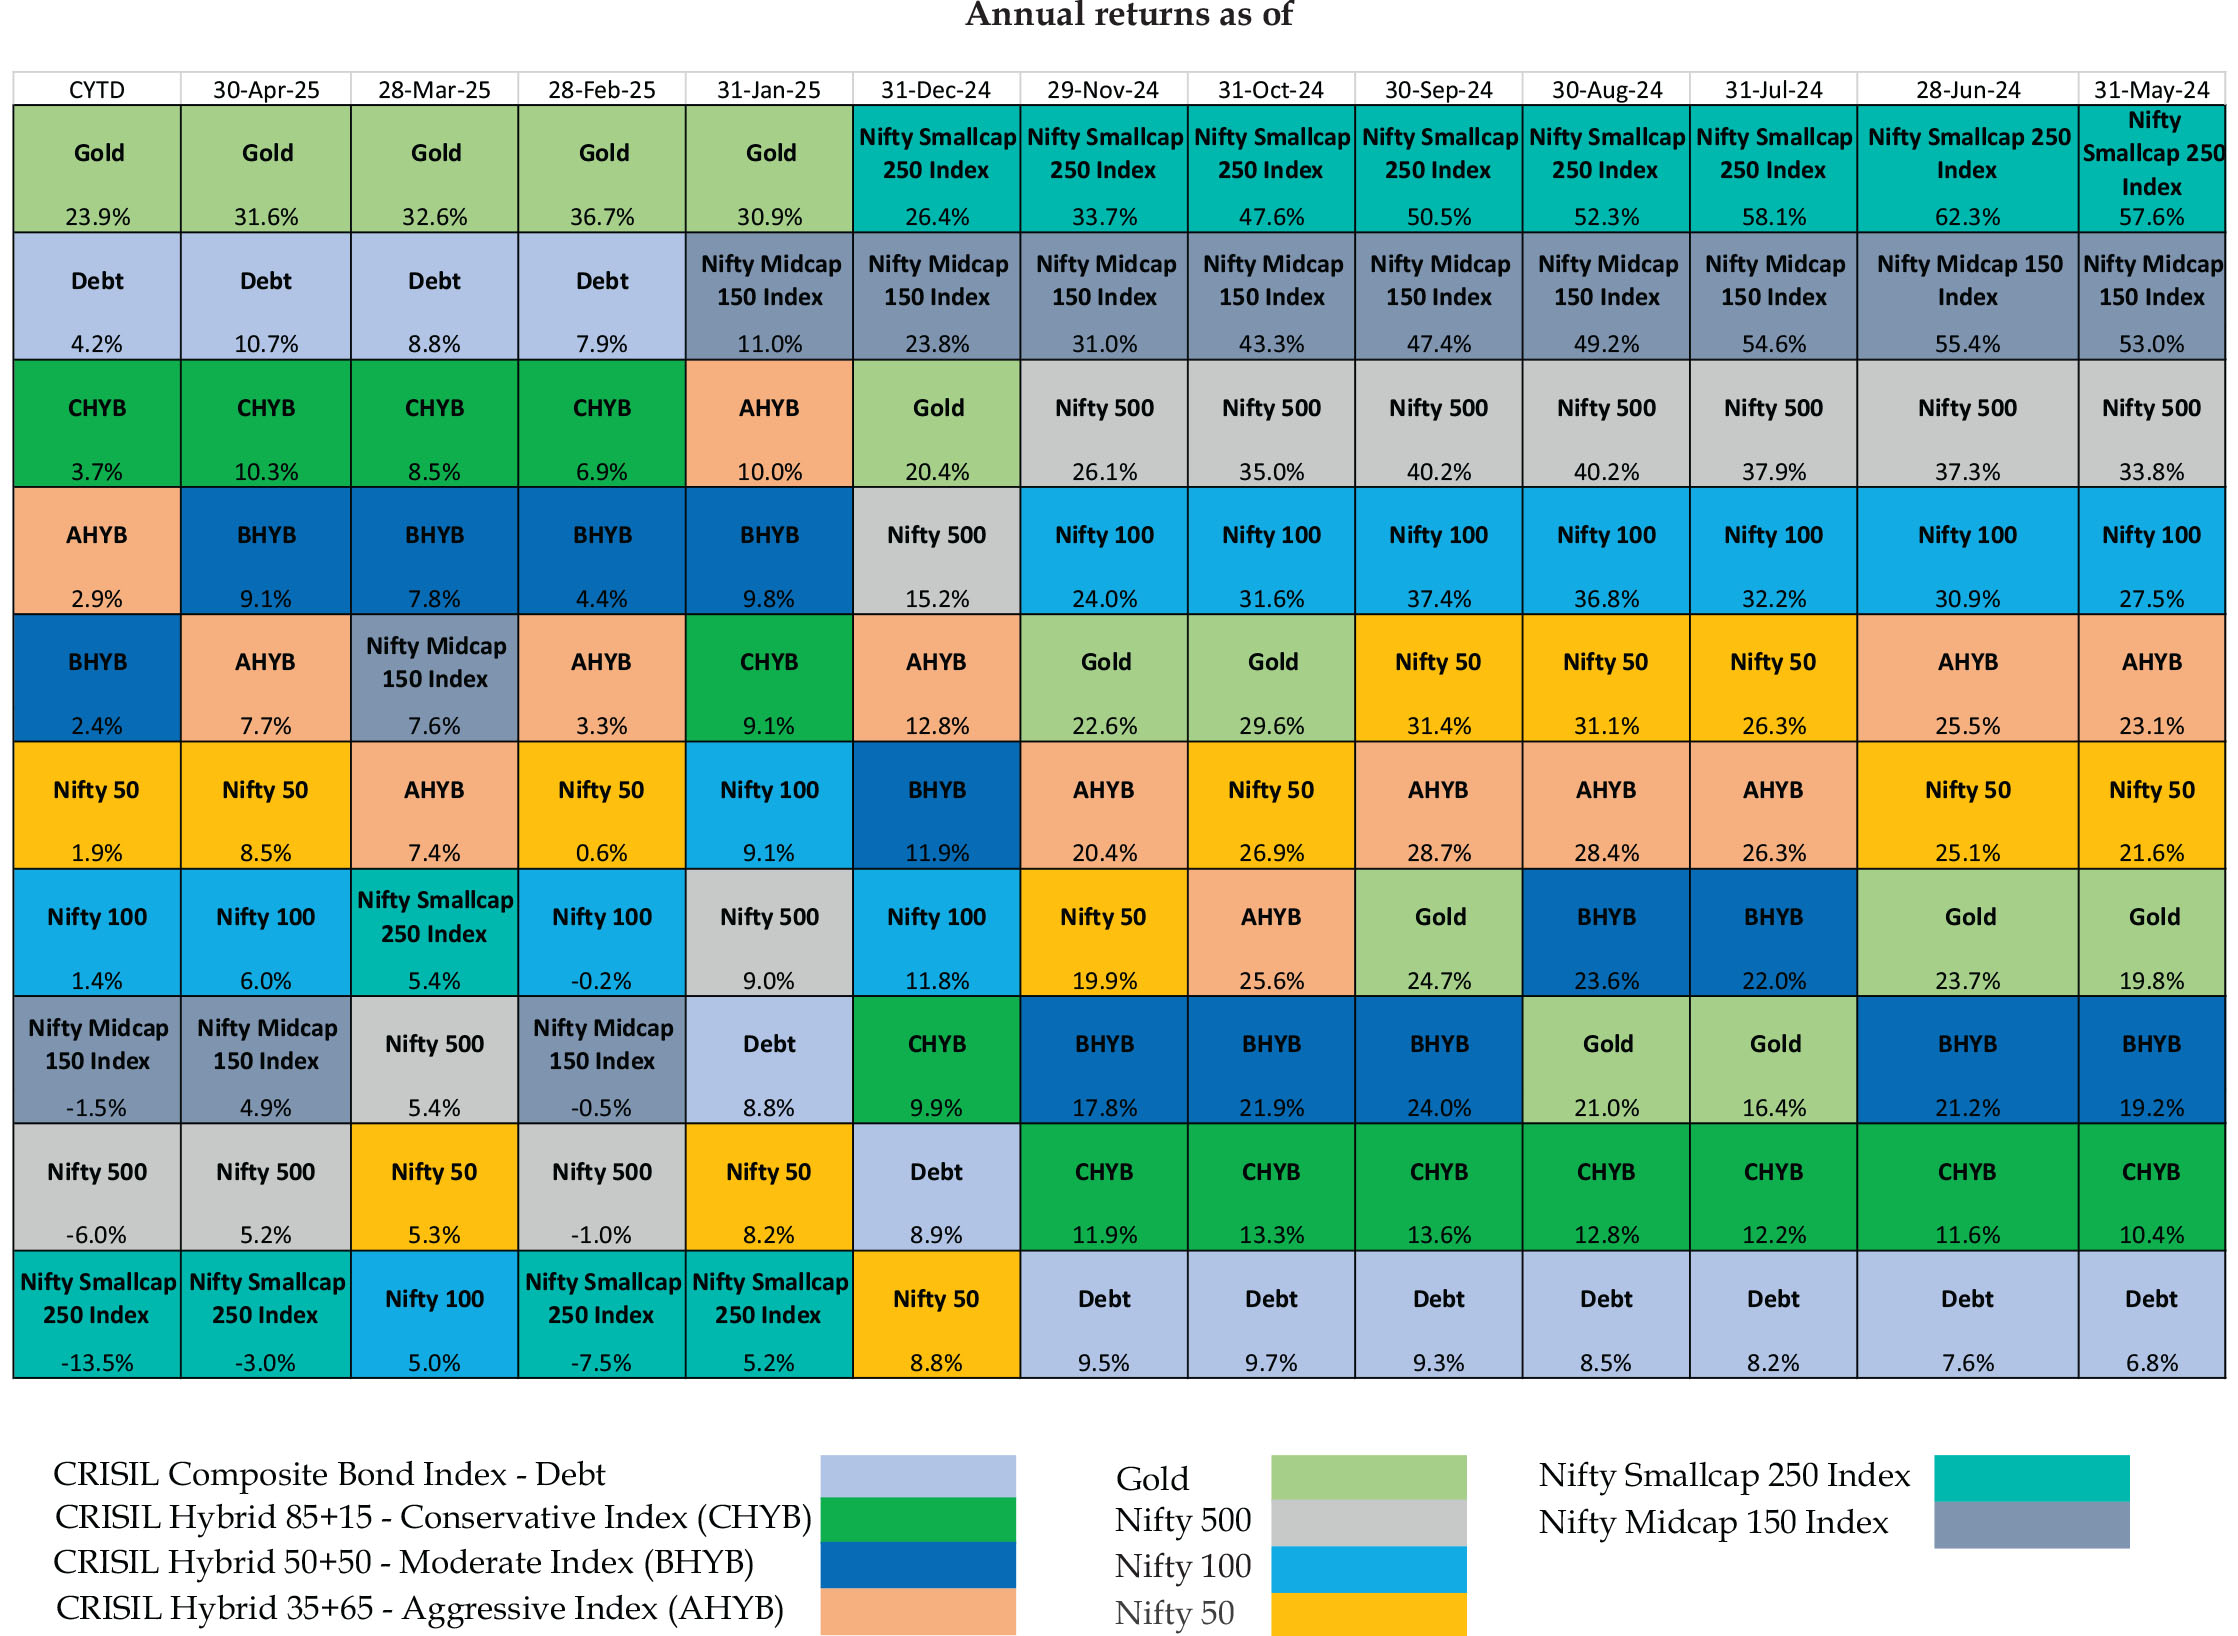
Asset class performance trends
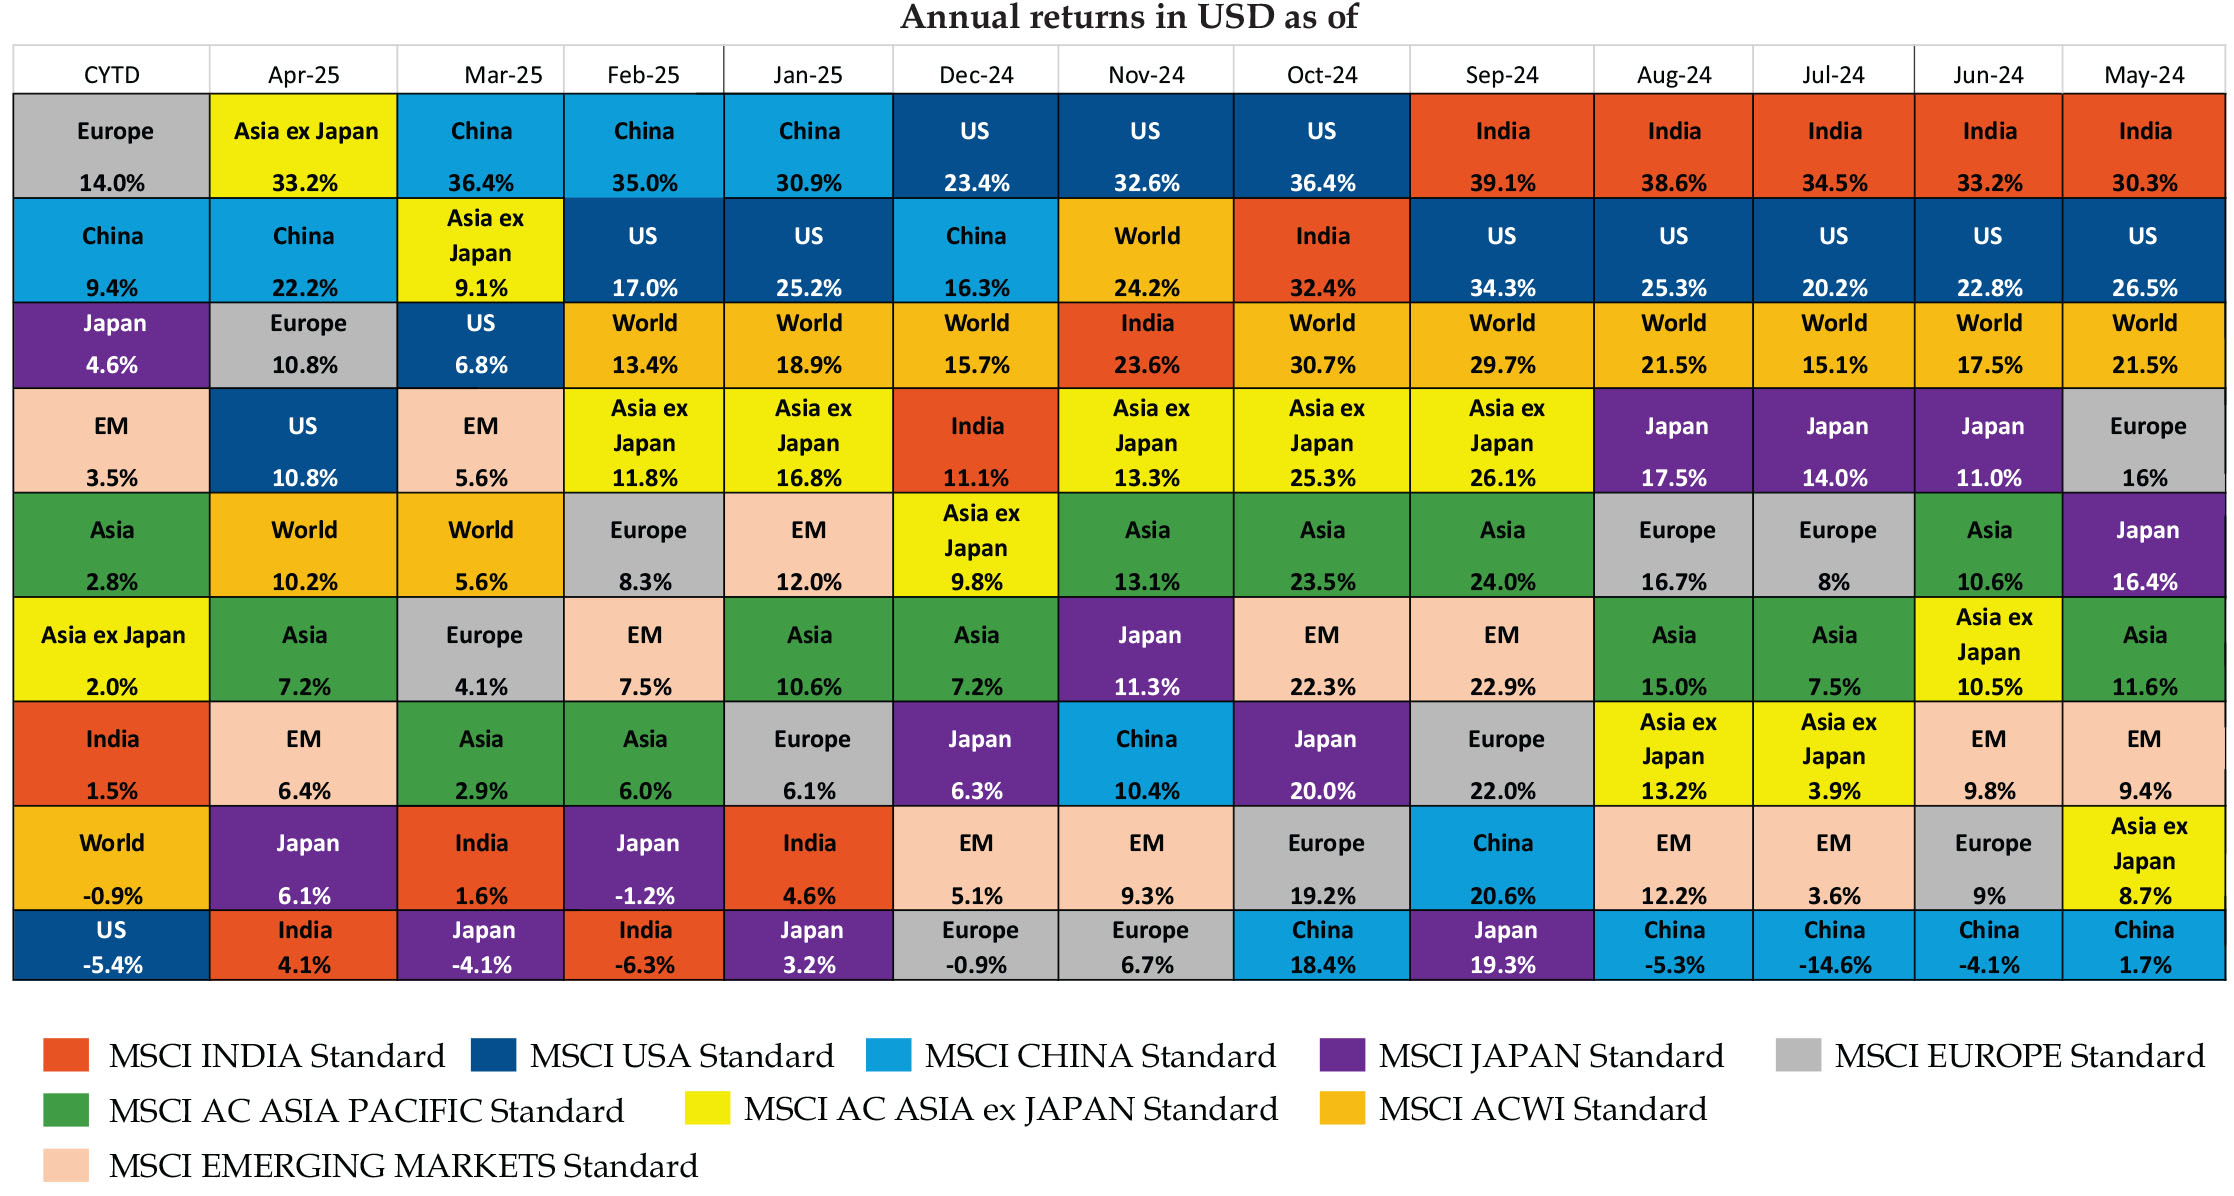
Geographical performance trends based on MSCI country level Indices
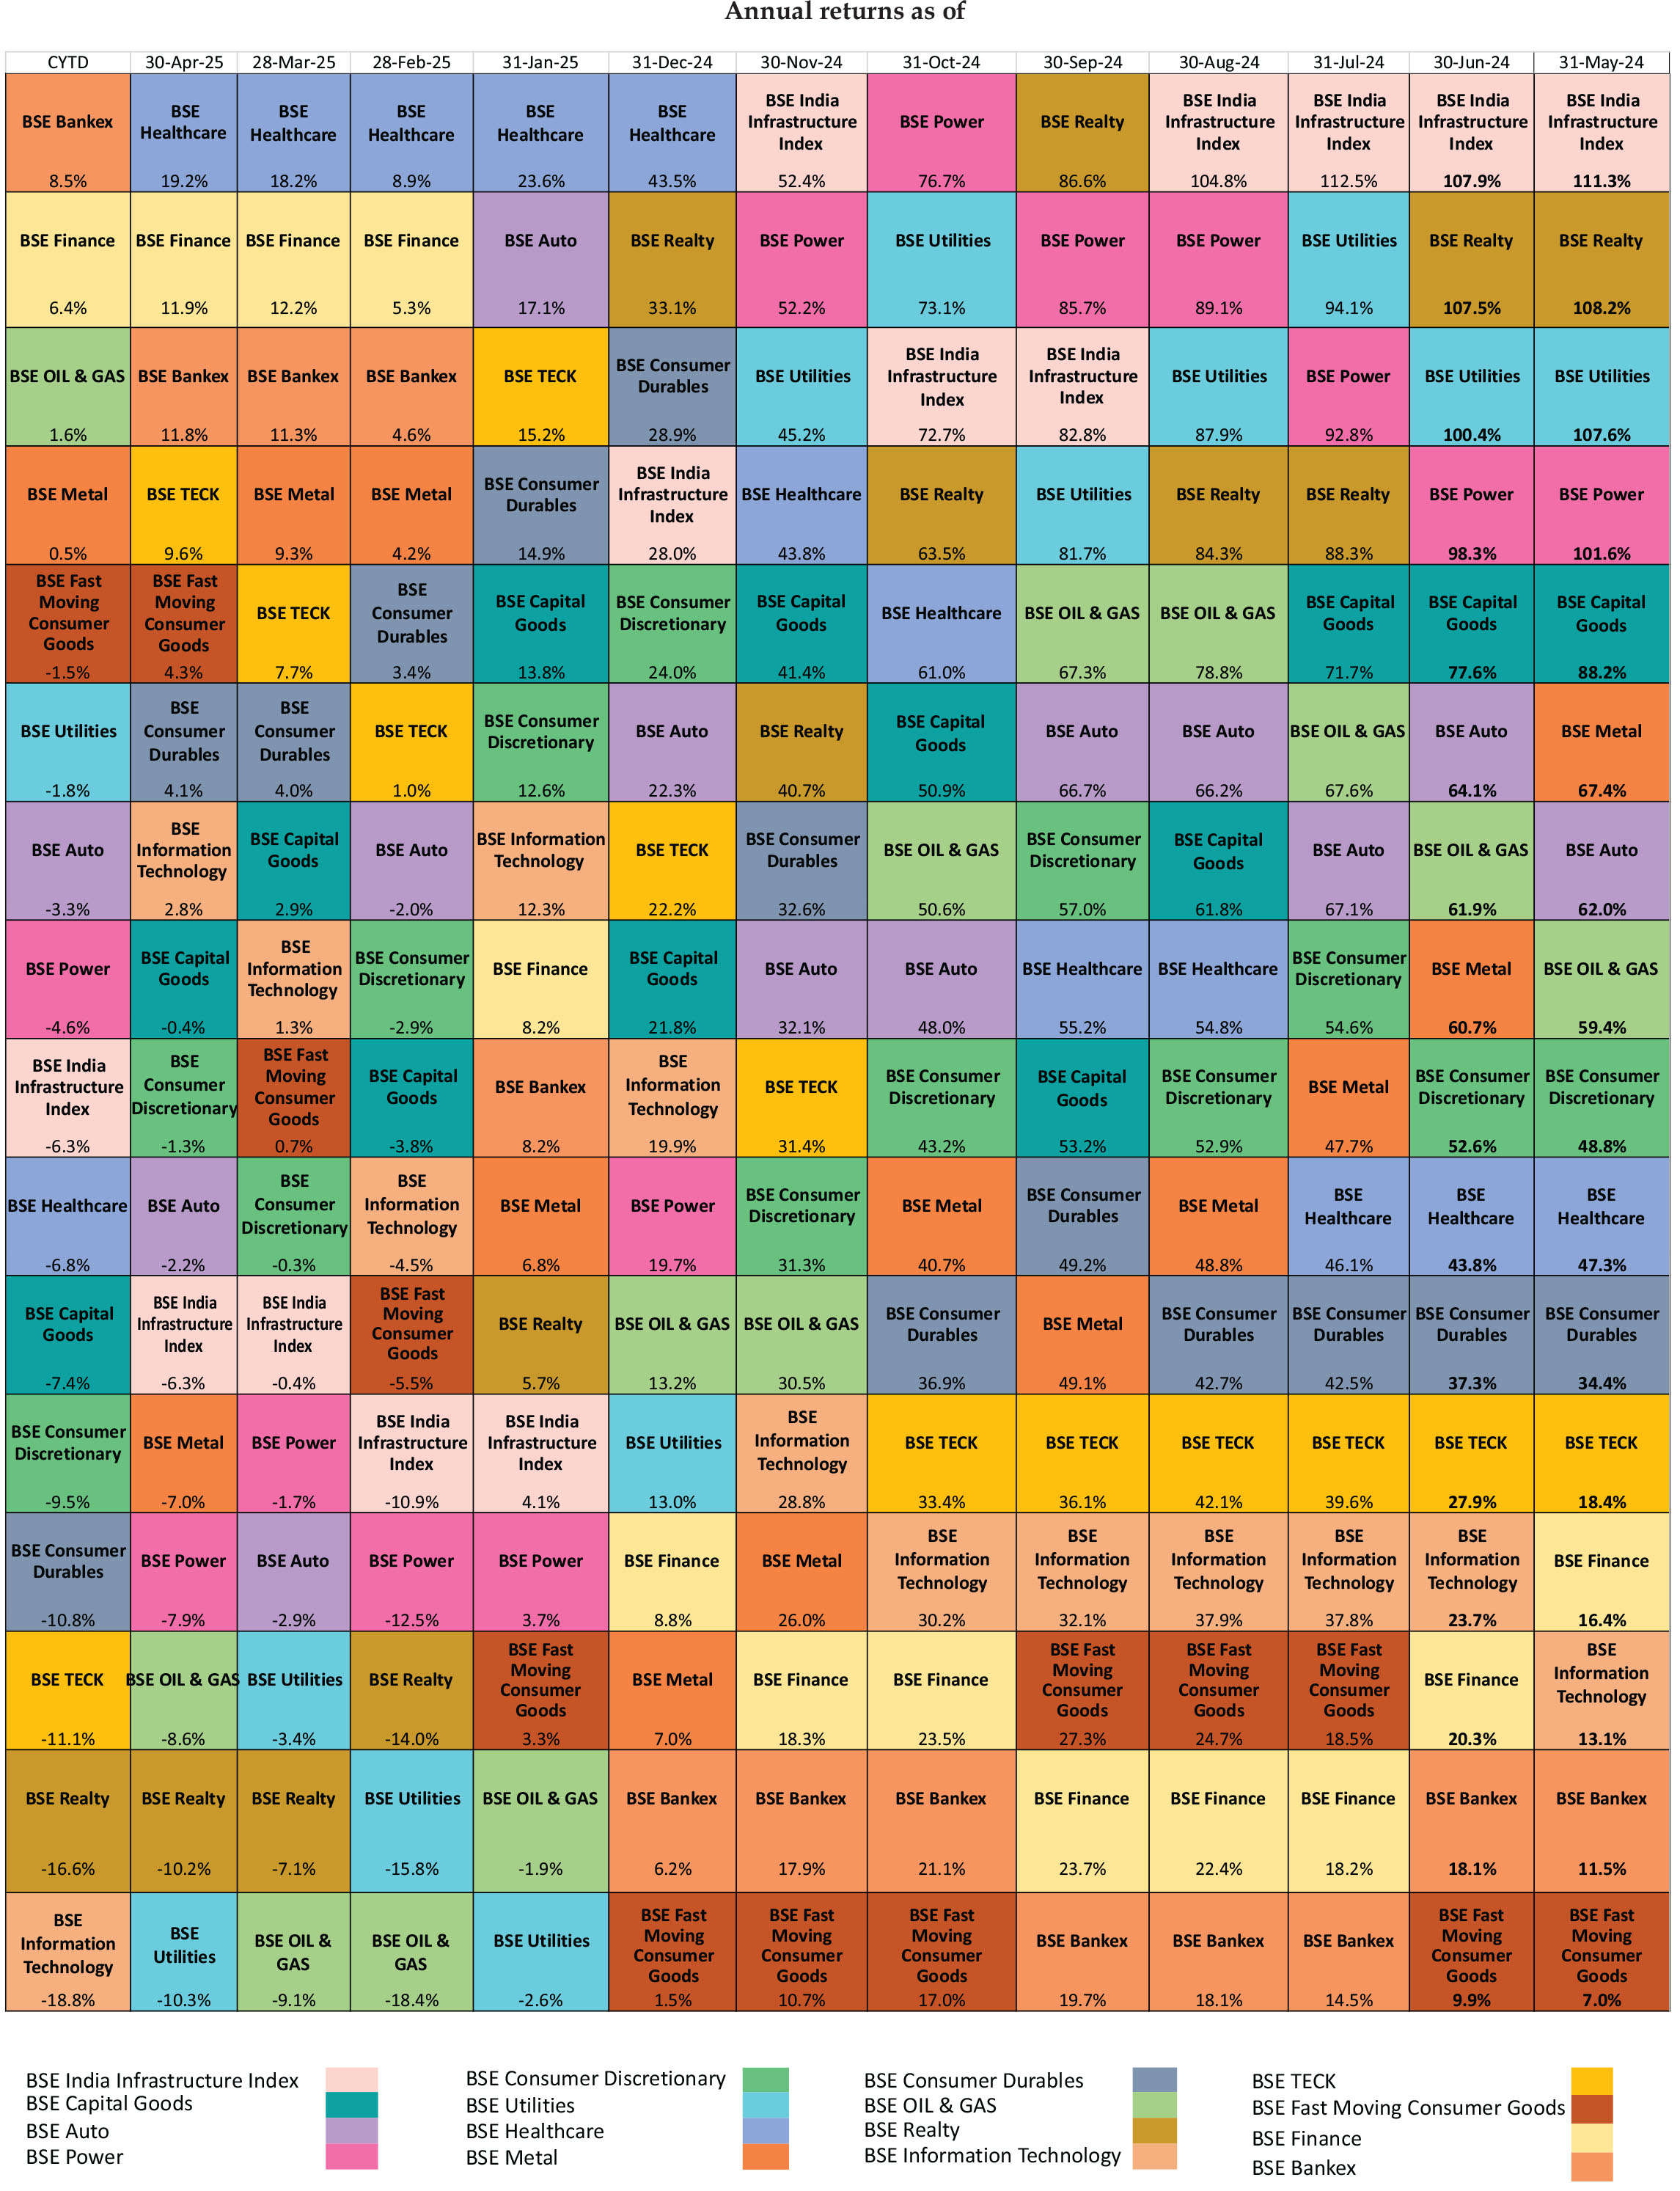
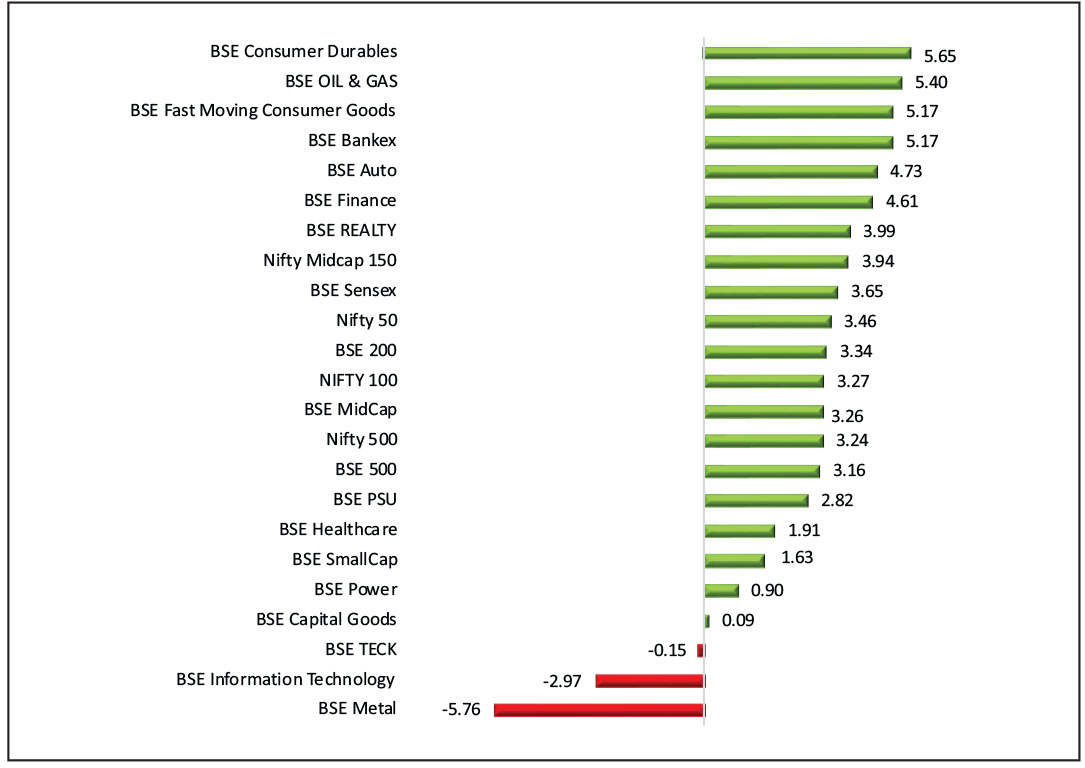
Sectoral performance trends
Global Market Performance (February 2026)
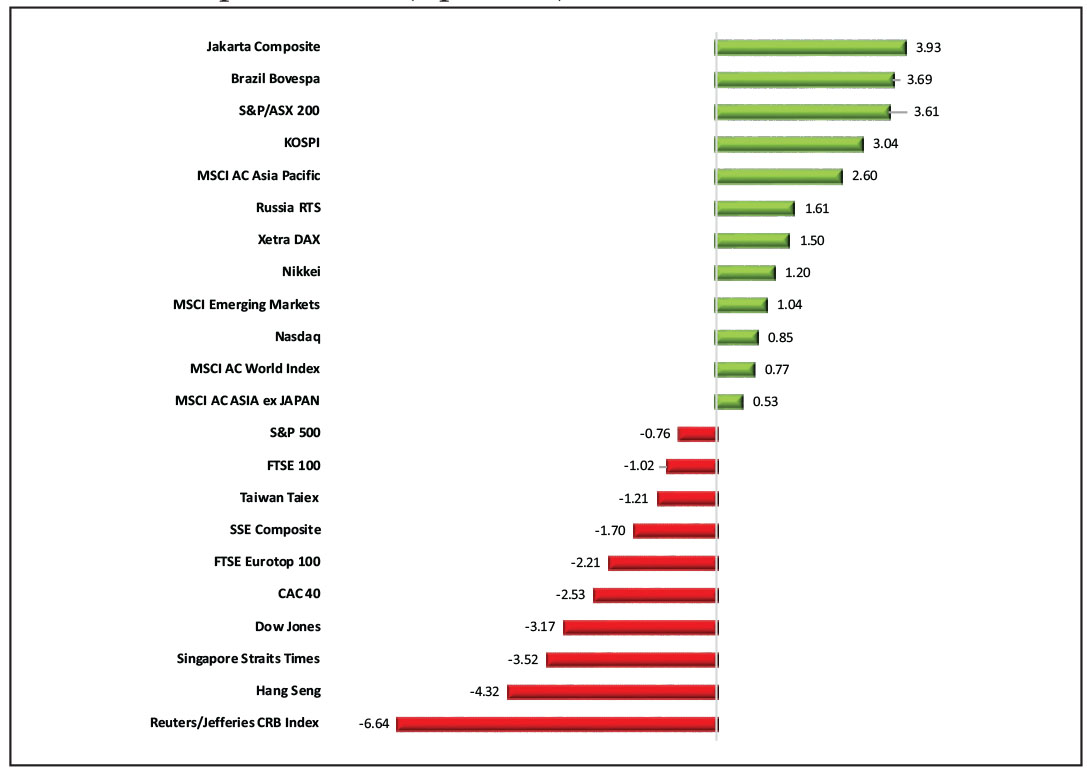
February 2026 delivered modest gains for global equities, but underlying performance signaled widening regional and sectoral dispersion.
In the US, the Nasdaq and S&P 500 turned negative, reflecting pressure on mega-cap technology leaders as investors reassessed valuation premiums against evolving AI-related risks. Earnings updates placed strong emphasis on AI capital expenditure and monetization, underscoring the emerging divide between AI beneficiaries and companies vulnerable to structural displacement.
The month was particularly challenging for US software firms. Demonstrations that highlighted AI's ability to rapidly and cheaply generate software underscored a potential shift in competitive dynamics, prompting material drawdowns across the software sector.
Policy-related uncertainty intensified after a Supreme Court decision on tariff precedents and the subsequent implementation of a temporary global tariff schedule. This was compounded by rising geopolitical tensions linked to US–Iran developments.
Asia offered pockets of strength, with Korea and Taiwan benefiting from robust demand trends in technology hardware and semiconductors. Conversely, China extended its underperformance as waning domestic growth momentum continued to weigh on investor sentiment.
Domestic Market Performance (February 2026)
The broader Indian equity market registered its third consecutive monthly decline, as late-month escalation in US–Iran tensions and ongoing concerns about AI-driven disruption overshadowed improving corporate earnings and easing trade worries following India's trade deal with the EU and an interim agreement with the US.
The IT sector came under renewed pressure as Anthropic's launch of advanced automation tools intensified worries over the long-term competitiveness of traditional services and software firms.
For February 2026, the Nifty 50 slipped 0.6%, while the Nifty Midcap 150 and BSE Smallcap Index posted modest gains of 1.6% and 0.5%, respectively.
Macroeconomic indicators:
Crude oil prices – Brent
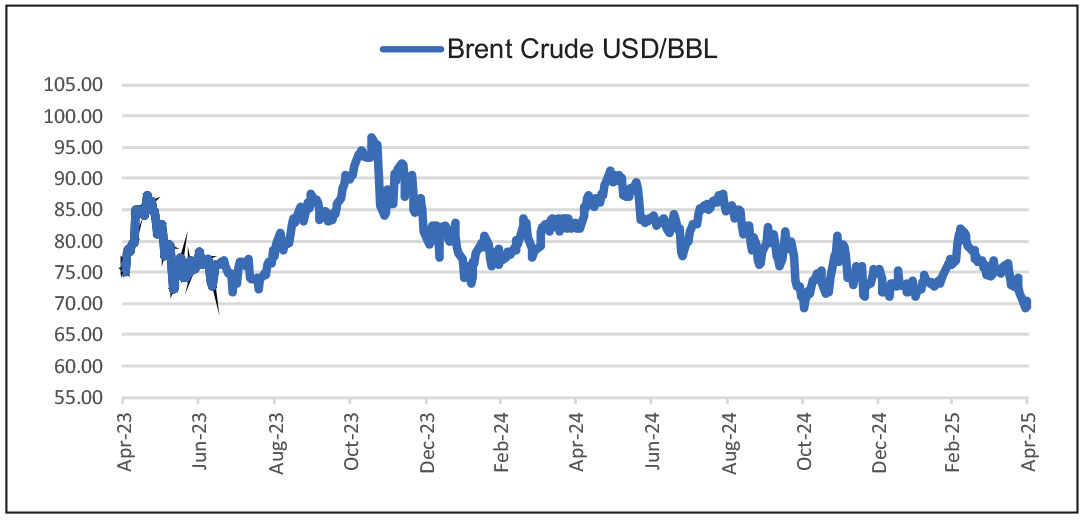
Brent crude climbed 5% in February as geopolitical risk resurfaced in the form of US-Iran conflict.
USD INR
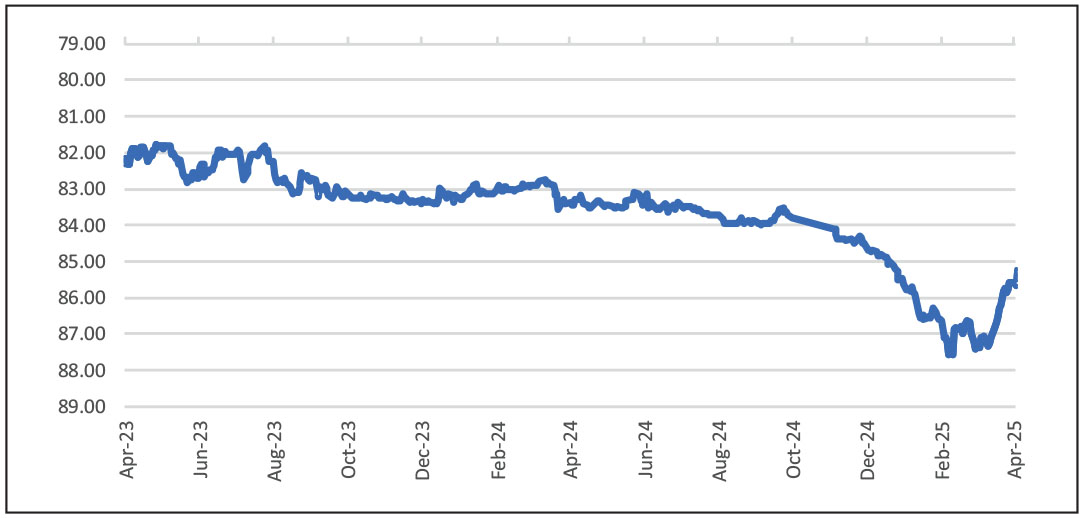
The Rupee gained by 1.1% (1 rupee) in February 2026 ending at 90.98 against the US Dollar, compared to 91.99 in January 2026 as foreign portfolio investor (FPI) flows turned positive in February 2026 from negative in the previous month.
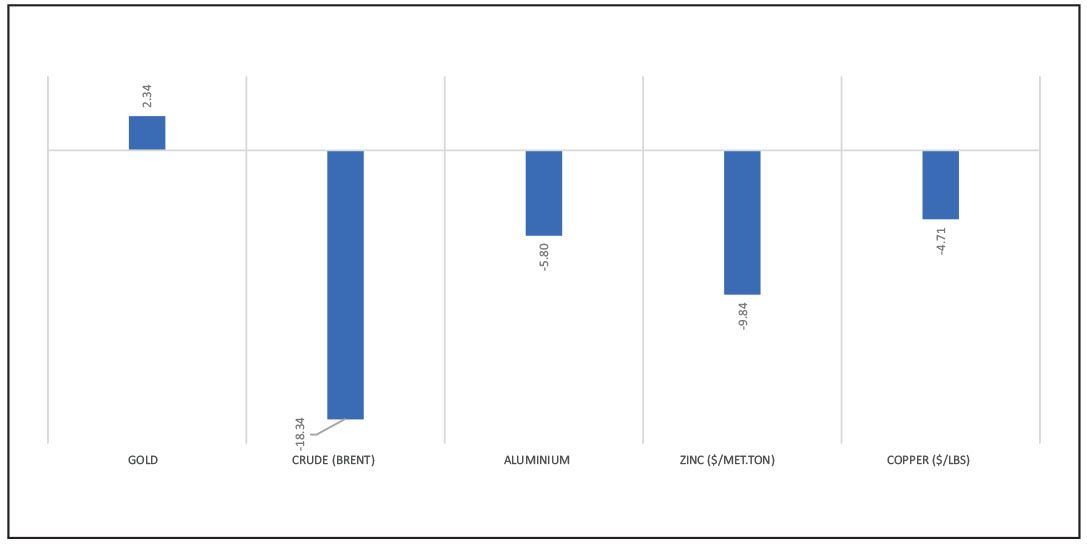
Commodity price trend
Forex reserves
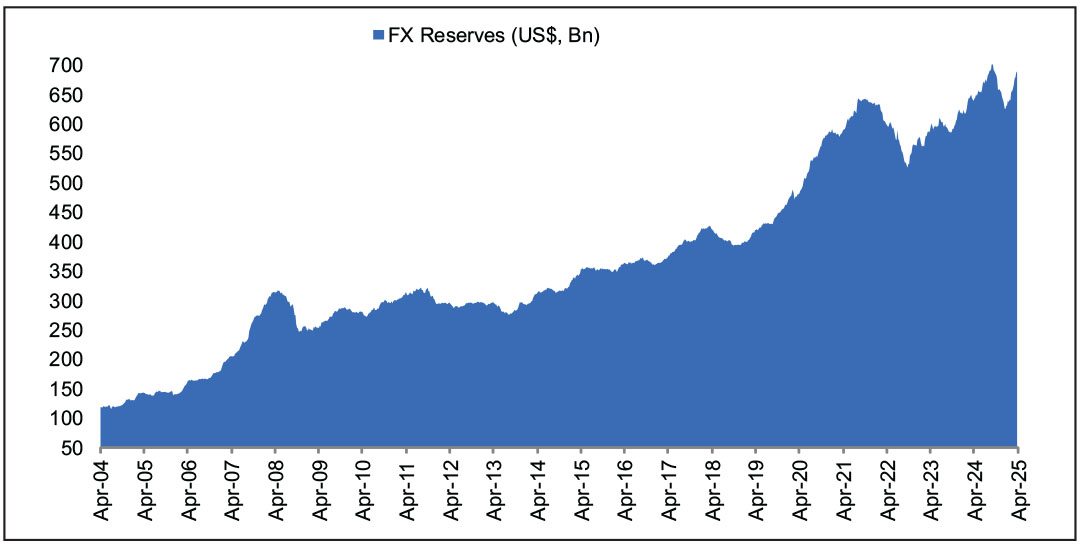
India's foreign exchange reserves rose by 0.65% to US$ 728 billion as of February 27, 2026, from US$ 724 billion on January 30, 2026.
Inflation
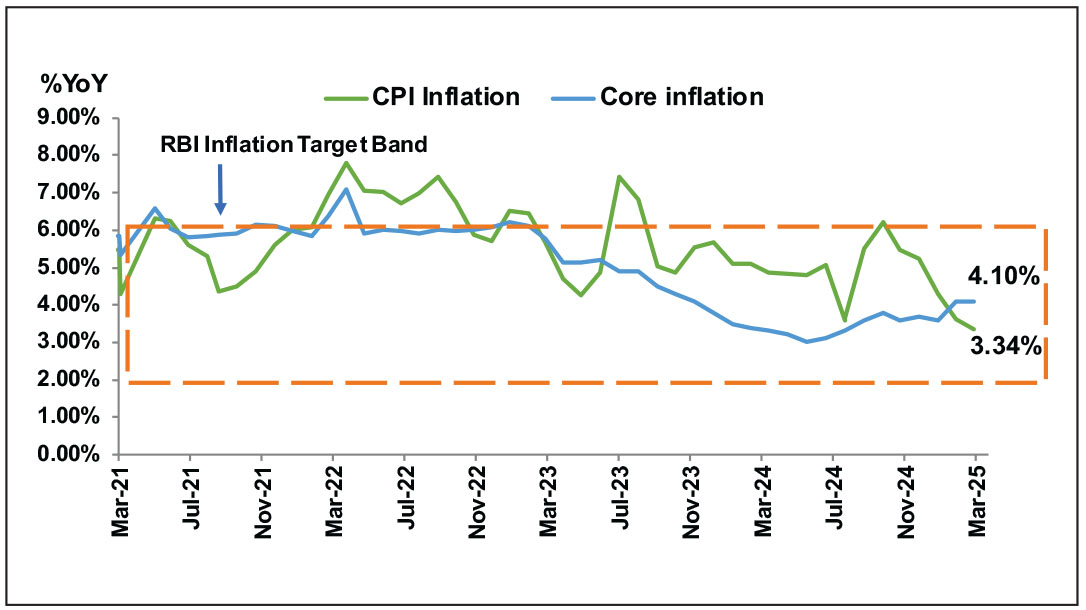
Headline inflation (CPI 2024 base year series) eased to 2.8% in January, with core inflation at 3.4%, which drops to 1.9% when precious metals are excluded, showing that underlying price pressures remain subdued. Core inflation made up most of the overall inflation, followed by food and fuel. Among non-food items, jewellery (gold, diamond, platinum) alone contributed 31 basis points to headline inflation.
Industrial production
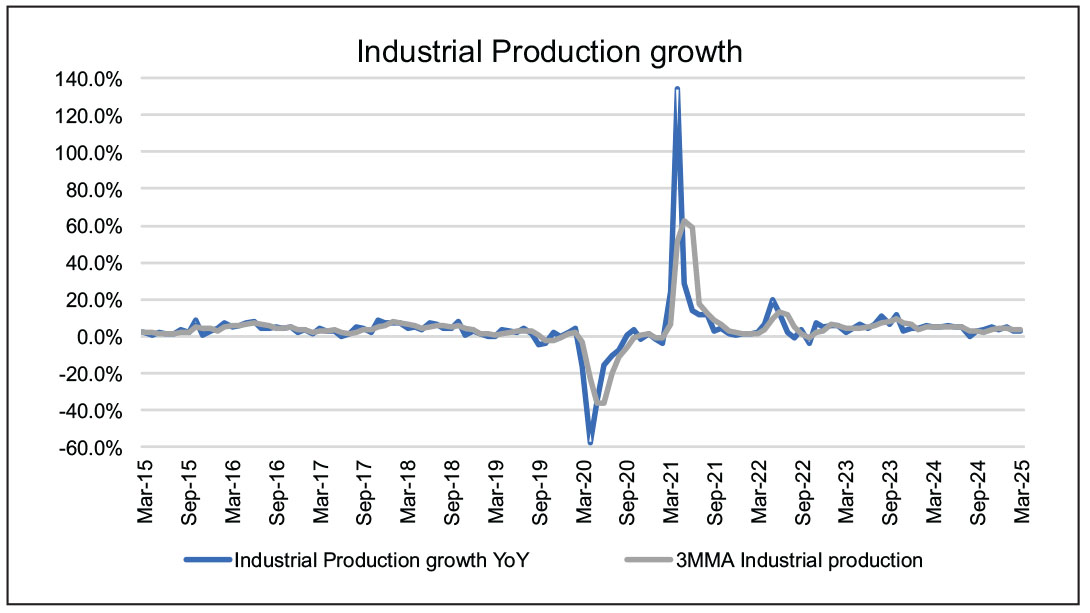
India's Index of Industrial Production (IIP), growth softened to 4.8% in January 2026, marking a three-month low and a moderation from the strong 8% expansion recorded in December 2025. The deceleration was broad across sectors mining slowed to 4.3% (from 6.9%), manufacturing to 4.8% (from 8.4%), and electricity output to 5.1% (from 6.3%). While base effects played a role in the month-on-month moderation, activity levels across segments remain steady.
PMI Indicators
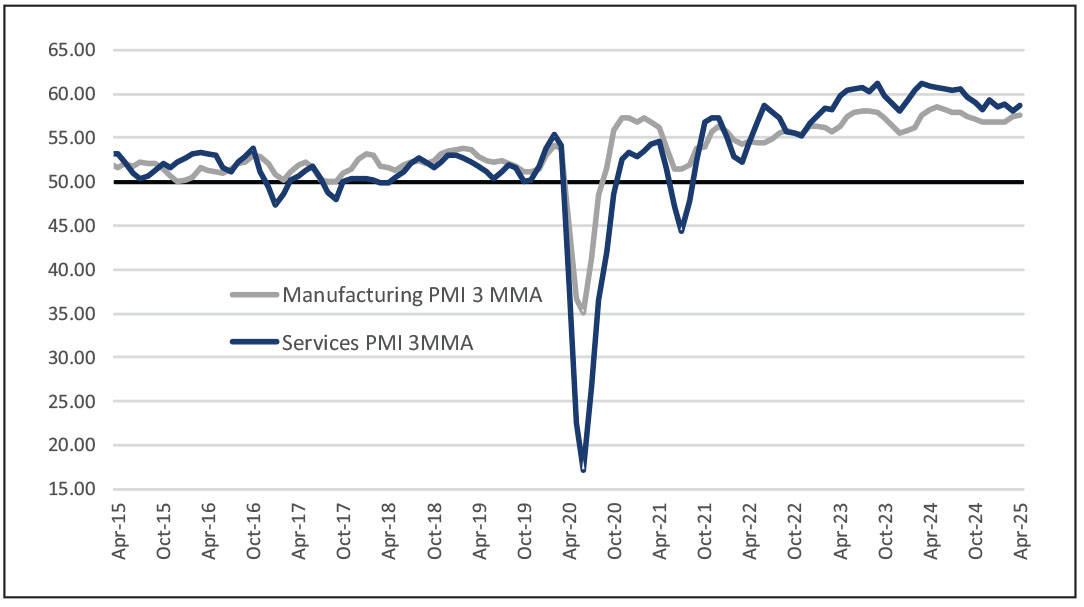
The Manufacturing Purchasing Managers' Index (PMI), in February 2026, strengthened signalling an acceleration in factory-sector activity. Output growth improved for the second month, driven primarily by firm domestic orders, even as export-order growth continued its gradual slowdown that has persisted since mid-2025. The Services PMI held steady, reinforcing the sector's strong expansionary momentum. New order growth moderated to its lowest level in over a year due to heightened competitive pressures, but service providers reported a meaningful rise in overseas demand and responded with higher hiring levels.
GST Collection
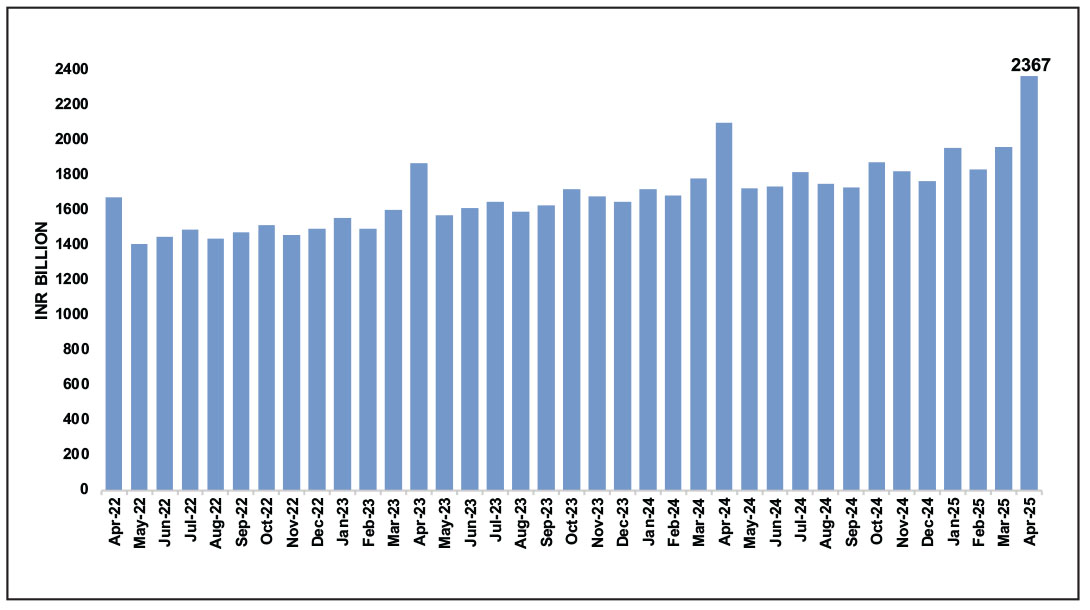
February 2026 saw a robust rise in GST collections, with gross revenue reaching INR 1.83 lakh crore an 8.1% year-on-year increase. Cumulative collections for FY26 totalled INR 20.27 lakh crore as of February 28, pointing to sustained momentum in consumption and business activity.
FII/DII equity flows
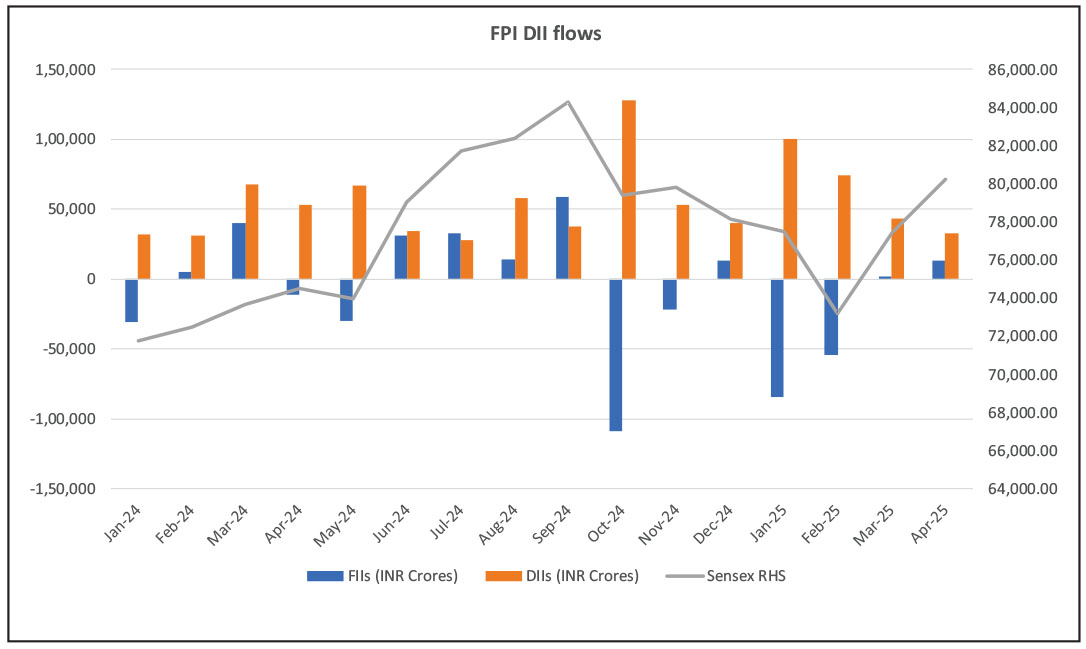
Domestic Institutional Investors (DIIs) continued to provide support in February 2026, buying about ~INR 38K crore. Foreign Portfolio Investors (FPIs), meanwhile, registered modest net selling of around ~INR 6,000 crore during the month.
Domestic Interest rate trend
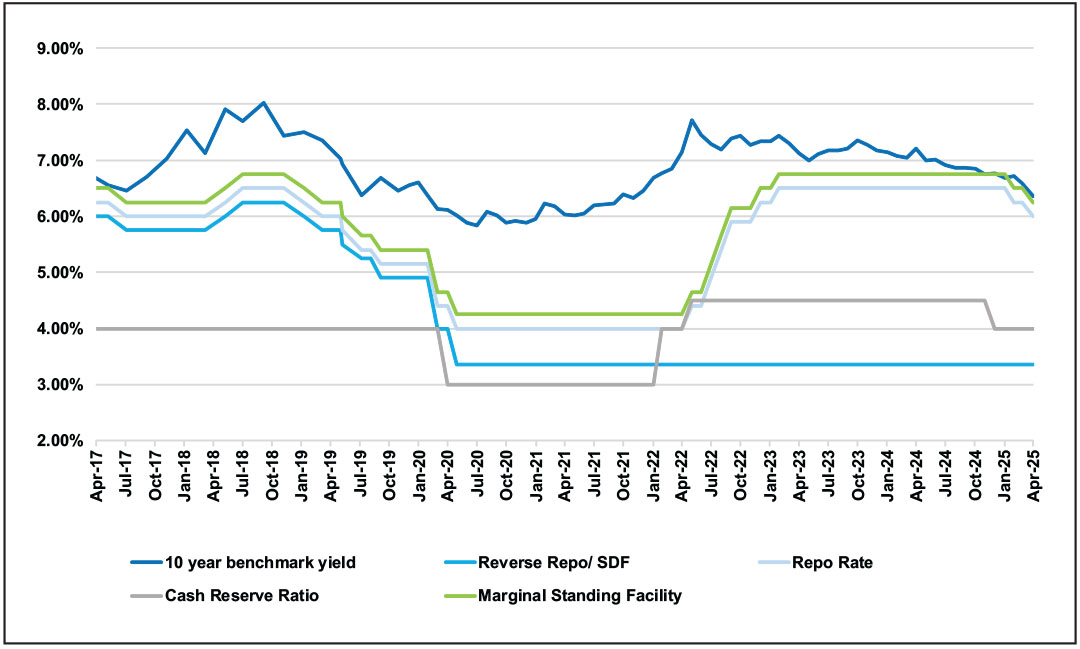 In its February 2026 monetary policy meeting, the RBI decided to keep the repo
rate unchanged at 5.25% and maintained the stance at neutral. This marks a
second pause after a cumulative reduction of 125 basis points in the rate-cutting
cycle that began in February 2025.
In its February 2026 monetary policy meeting, the RBI decided to keep the repo
rate unchanged at 5.25% and maintained the stance at neutral. This marks a
second pause after a cumulative reduction of 125 basis points in the rate-cutting
cycle that began in February 2025.Domestic Liquidity Conditions
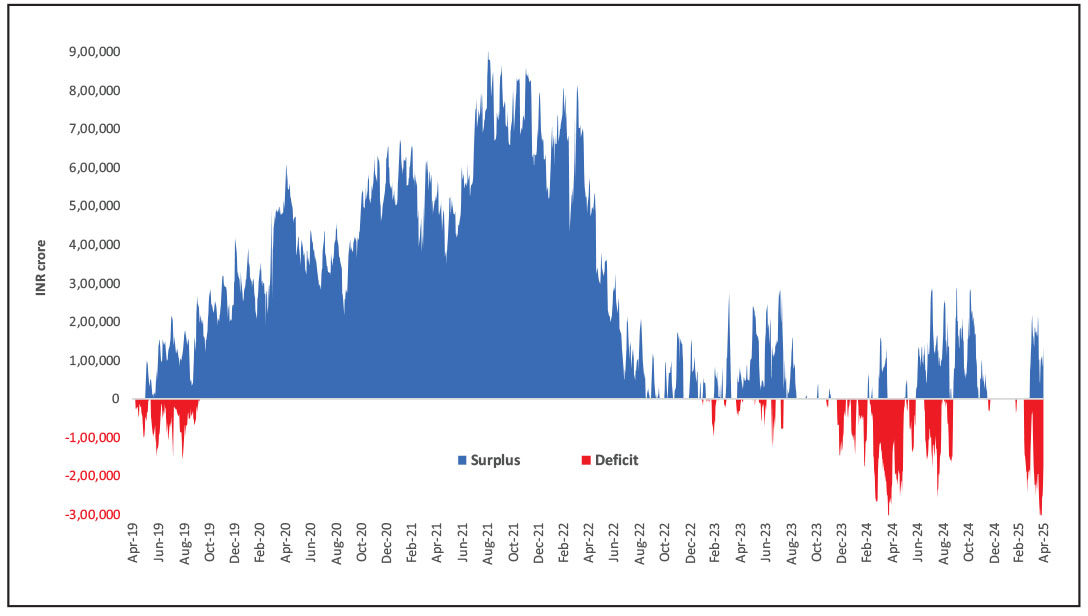
Average monthly system liquidity rose to INR 2.55 lakh crore in February 2026, marking its highest level in six months. This sharp increase represents nearly a fourfold jump compared to January 2026. This expansion was driven by a combination of factors, including stronger government spending, multiple liquidity enhancing measures by the RBI, and sustained net inflows from foreign investors.
Yield Curve
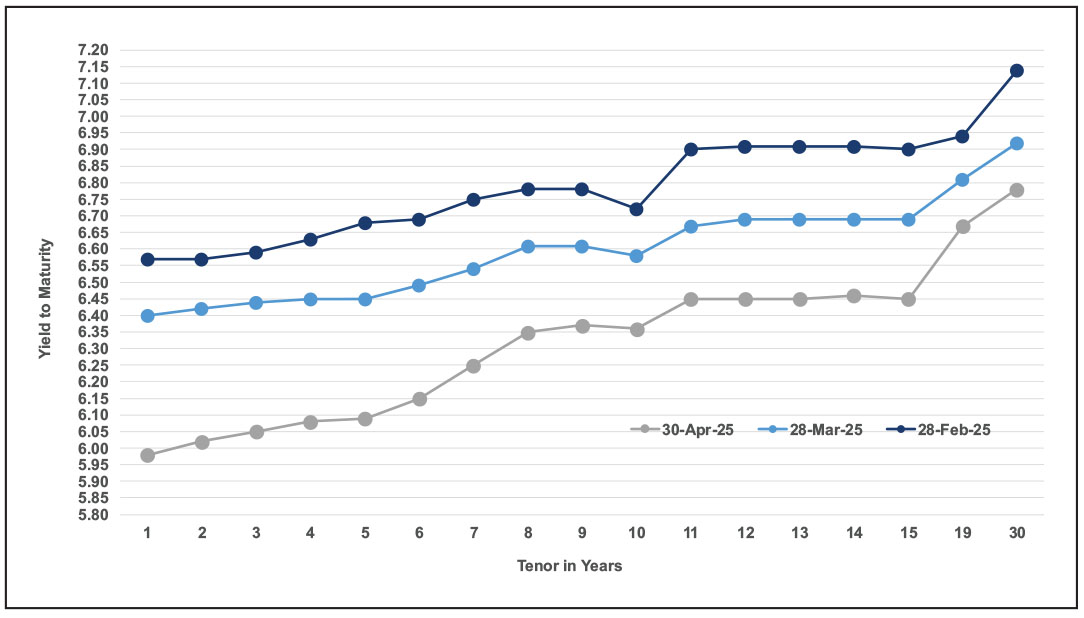
India's benchmark 10-year government bond yield fell by 4 bps to 6.6% in February 2026, down from 6.7% in January 2026, driven by global rate cues, sustained inflows, and stable domestic fiscal conditions
Domestic Macros Heatmap
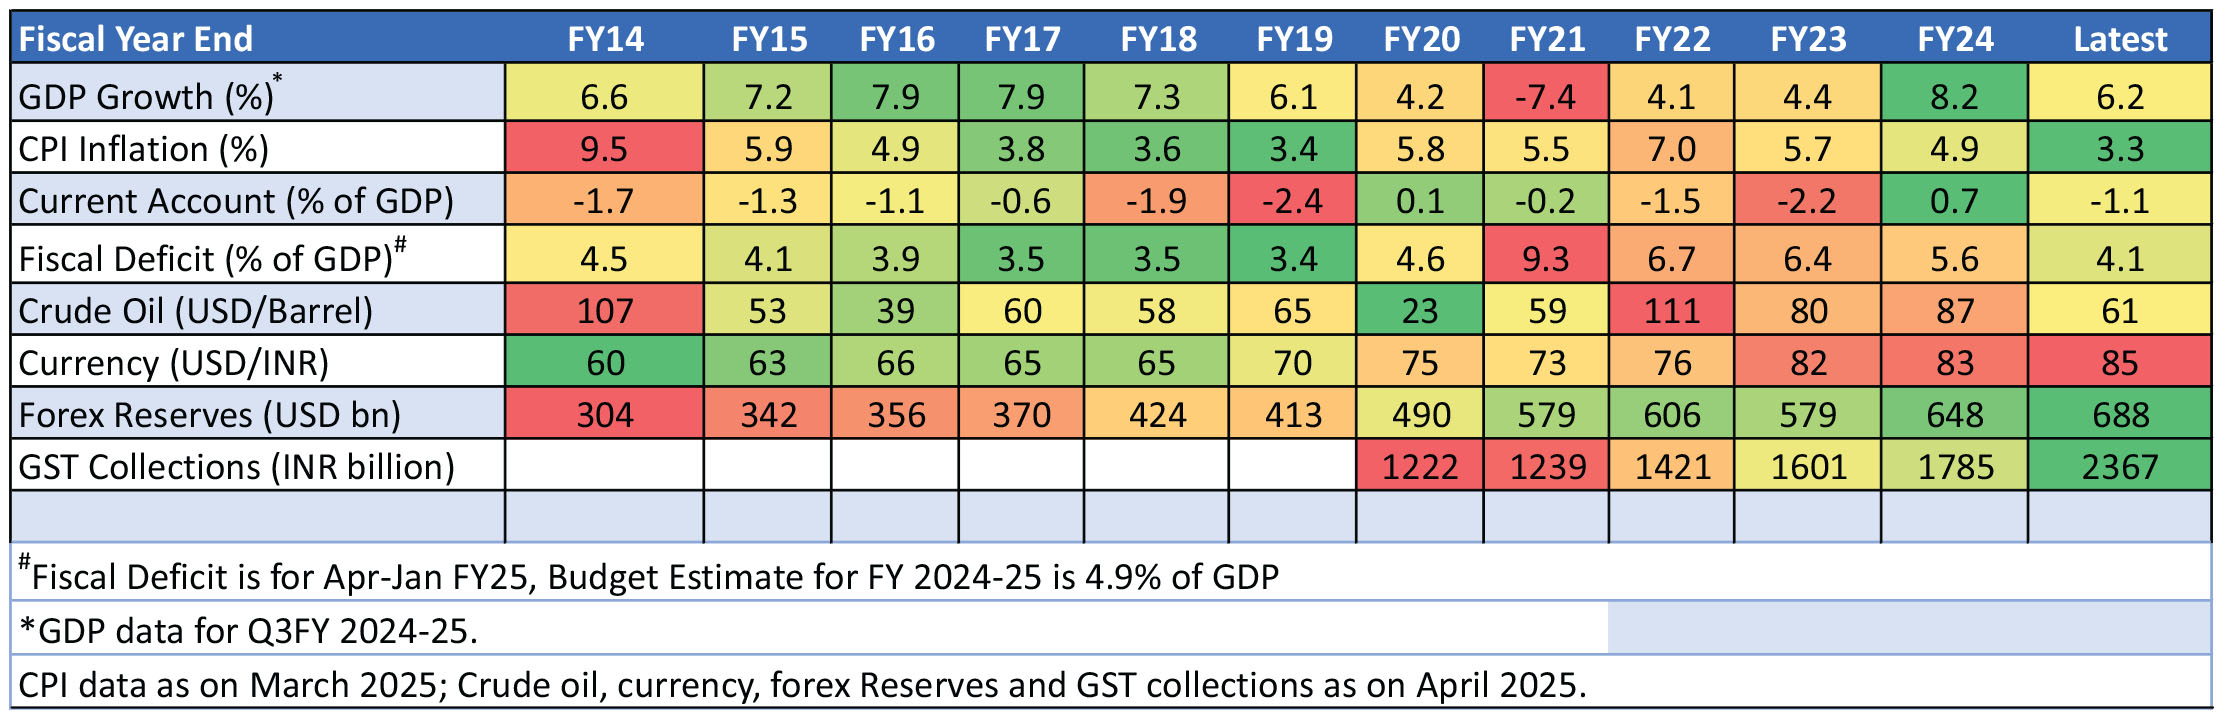
Source: Bloomberg, RBI, MOSPI, Morgan Stanley